What is Report Automation? How Can it Increase Data-Driven Decisions?

Chioma Dunkley, Mode Team Writer
September 22, 2022
NaN minute read

Delivering insights at the necessary time is crucial to driving business impact and becoming a data-driven business.
Data teams are constantly juggling requests to build new reports, answer one-off questions with ad hoc analysis, and distribute data to the people who need it across an org. Without report automation though, the data team's responsibilities can start to include tedious manual work like sending out the same report, manually rerunning queries to pull the freshest data, and copying and pasting report links for various stakeholders in communication channels. Overall, it can look like a lot of repetition and not a lot of actual analysis.
It doesn’t have to be like this. With the right tools for data analytics, report automation can make data team workflows easier, data more accessible, and your entire business more data-driven. In this piece, we’ll discuss what report automation can look like, its benefits, and how you can automate reports in Mode.
Understanding Salesforce CRM Data: A Complete Guide for Analysts
You've just been handed your company's raw Salesforce data. What do you do first? Welcome to your crash course in understanding Salesforce and its data.
What is report automation?
Report automation is the process of having business reports automatically updated and delivered through platforms on a specified schedule. It includes data being automatically extracted, visualizations being automatically updated, and reports being automatically shared without anyone having to manually do this work every time. It’s delivering business insights to users and top management without extra labor.
For businesses, it’s a bread-and-butter technical ability to optimize workflows and quicken decision-making.
Benefits of report automation for your company
Automating reports can positively impact not just select individuals or teams, but your entire organization.
1. It cuts down time and effort for your data team
Sending out the same report to various individuals across an org manually is time-consuming and adds on a lot of menial labor. Automating reports cuts down the time and effort of redundant tasks—especially impactful for small data teams.
2. It increases productivity
With less time spent on repetitive and manual data sharing tasks, data teams are able to spend more time on actual analysis.
3. It saves costs
Saving time saves money. Analysts don’t have to spend chunks of their day on a task that can easily be automated.
4. It increases real-time decision-making
With automatically refreshed data that's shared out to teams across an org., stakeholders and management teams can have accurate data at their fingertips. In fact, AI trends show that more than 70% of enterprises are now relying on AI-powered tools for real-time data integration and processing. This highlights how report automation is part of a larger movement toward data-driven, AI-enhanced decision-making.
5. It makes data more accessible
Having reports automatically sent out on a regular cadence can give teams consistent access and visibility to key metrics and helps in democratizing data.

Why Today’s Companies Need Collaborative Data Analysis
Business teams and data teams need to work on analytics together—here's how to accomplish that.
Things to consider when setting reports up for automation
Automating reports is an act of democratizing data, and with getting data out to the people comes responsibility. Here are a few notes to keep in mind.
Data accuracy
Sharing the wrong data defeats the purpose and leads to a failed workflow. If you’re the analyst on the team reading this, you’ll want to make sure that the data in the reports you share are correct, and that you are pulling from the appropriate data sources.
Database load & timeliness
As mentioned earlier, running reports can use up a lot of data. For a query that many users check daily, setting up a schedule to trigger the run before everyone gets online can be a big win and ultimately equate to just one run vs multiple runs from different users who are all viewing the same report.
Sharing channels
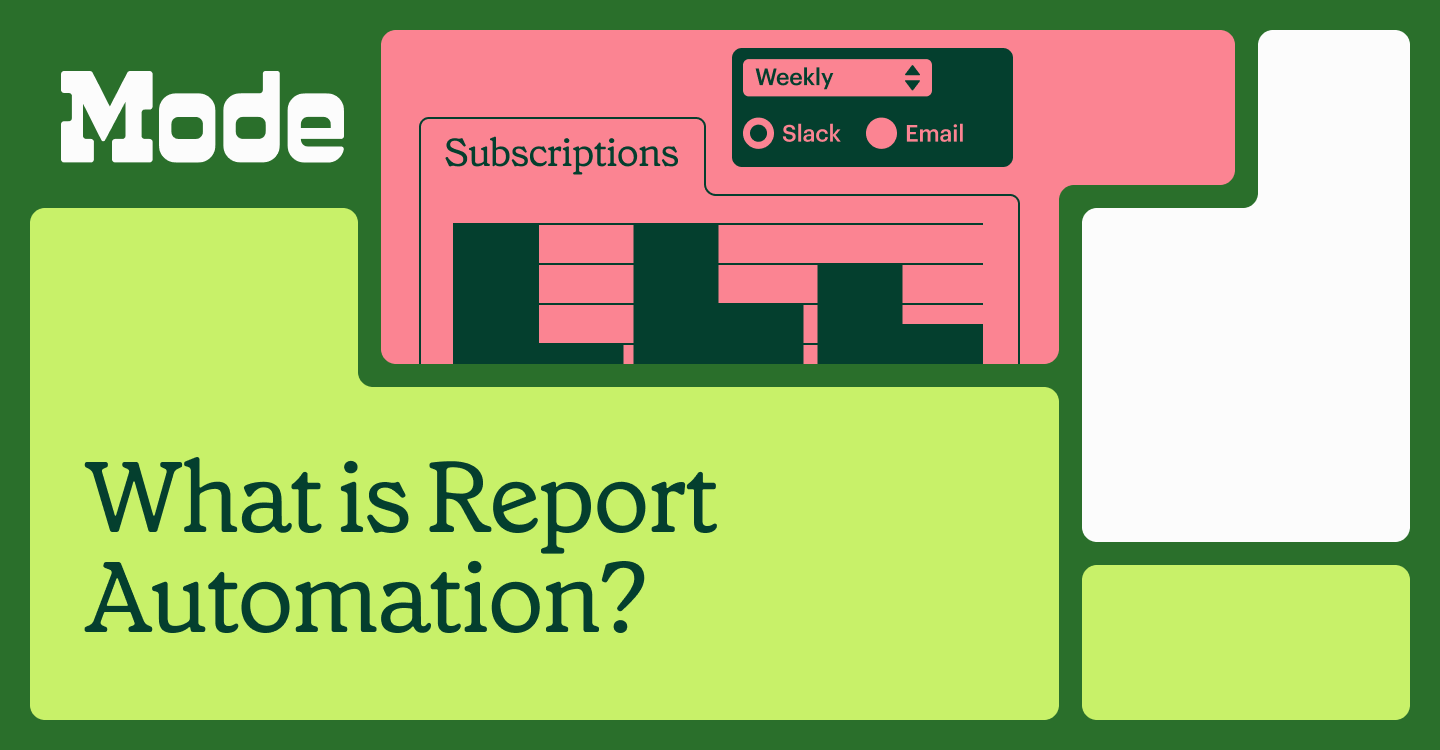
Scheduling reports to update automatically is great, but not if the people who need them the most don’t see them. With Mode, you can automate the act of delivering Reports in the places your team is, like Slack (including private channels), and Email with timed, scheduled deliveries.
Report automation in Mode
It wasn’t too long ago that in order to automate a report to run in a business intelligence (BI) tool, you would typically have to do it manually or with disjointed schedulers, cron tools, and cloud solutions.
Many business intelligence tools have now become more modern and sophisticated and now include features for scheduling and sharing reports automatically from the tool. However, some BI tools are still overly complicated and funky–making automating reports hard.
Mode differs from some of these tools, in that:
You can run queries without too much load on the database. Mode is a BI tool that sits on top of a data warehouse; reports can be automatically run without too much workload on the database thanks to Mode’s data engine, Helix.
You can schedule report links to be sent out on a schedule with a specified frequency. For sharing reports, Mode offers schedule frequencies like 30 mins, hourly, daily, weekly, monthly, and quarterly.
You can schedule reports when certain conditions are met using an API/Webhook for Slack and Email.
Automated reports include information about when the report was last edited and last run. You can even view additional metadata if using dbt integration.
Reports can be directly shared from the platform. Internal and external parties can have the ability to see visualizations on the Mode app. No need to extract reports to share them. Note that users can only see what you give them access to using permissions.
Reports can be shared to different platforms, like email and Slack automatically. If shared via email, reports can be delivered as a direct link, PDF, raw data, and CSV. If shared via slack, reports can be delivered as a direct link with a preview image.
Read more about Mode’s report sharing & scheduling here. See how Mode helped Education Perfect accelerate their report building and delivery for schools they serve.
Get our weekly data newsletter
Work-related distractions for data enthusiasts.


