Starbucks green. UPS brown. Target red. Some of the most recognized brands have built their visual identity on just one color. They create this fundamental association by including the color everywhere—from commercials and logos to packaging and websites.
We were curious: how does this color-centric visual identity carry over to social media and, more specifically, Instagram? If we boiled down a brand's Instagram photos to a handful of colors, could you identify the brand?
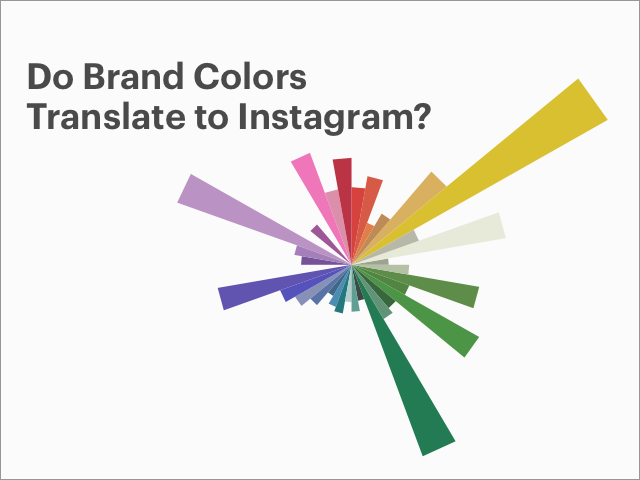
To find out, we looked at thousands of Instagram photos from 2015, reduced each photo to its most dominant color and created what we're calling a “color pinwheel.” We created the pinwheel below, for example, using the photos posted by an iconic jewelry retailer. Guess who.
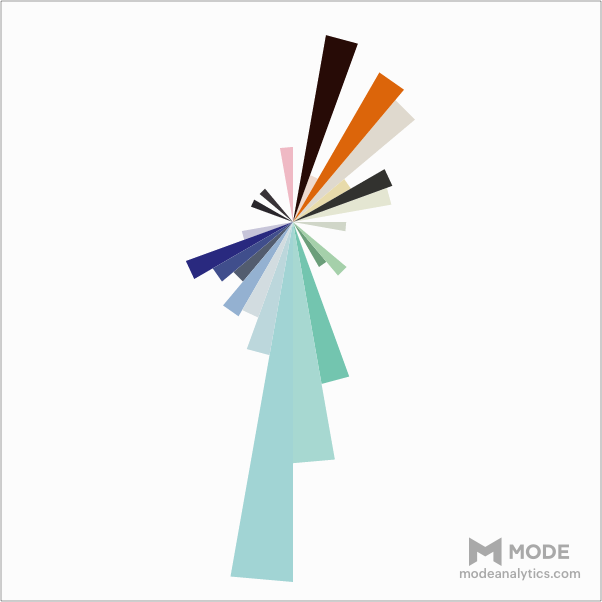
That Tiffany blue shines through, huh? While not every single photo includes their iconic robin egg blue, it's clear that Tiffany is deliberate about incorporating it. Their blue serves as the background in videos and for inspirational quotes, it's on the signature Tiffany boxes, and in the photos of holiday store displays.
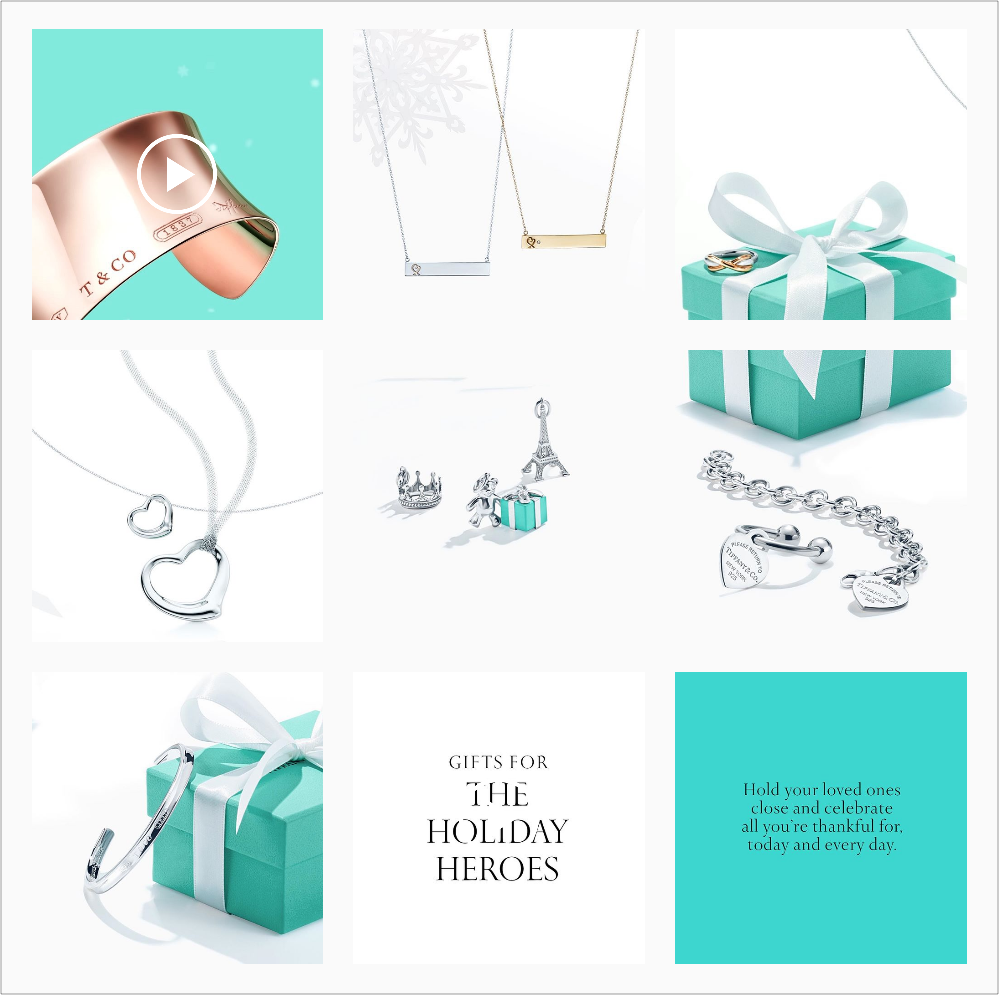 Via @tiffanyandco
And that's why Tiffany blue is the biggest wedge in their color pinwheel. It dominates.
Click through this SlideShare for more brand pinwheels.
To explore further, click on the images below to see all the pinwheels for each category.
Want to see more pinwheels? Check out this analysis of 72 popular Instagram photographers.
Methodology
So, how did we do it? First, we found all the photos an Instagram account posted in 2015 (for some, this meant 50 photos; for others, it meant thousands). Then we used Charles Leifer's method to extract the most dominant color from each photo. We loaded the data into Mode and started playing around with ways to explore the data.
As data, color is an interesting subject. Though there's no universal way to classify and compare colors, the major color frameworks—RGB, HSL, LAB—define colors along three dimensions. RGB and LAB have other useful characteristics (LAB, for instance, allows you to measure the “distance” between two colors”) but they don't lend themselves well to visual analysis. HSL (which stands for Hue, Saturation, Lightness), which is based on a traditional color wheel, does.
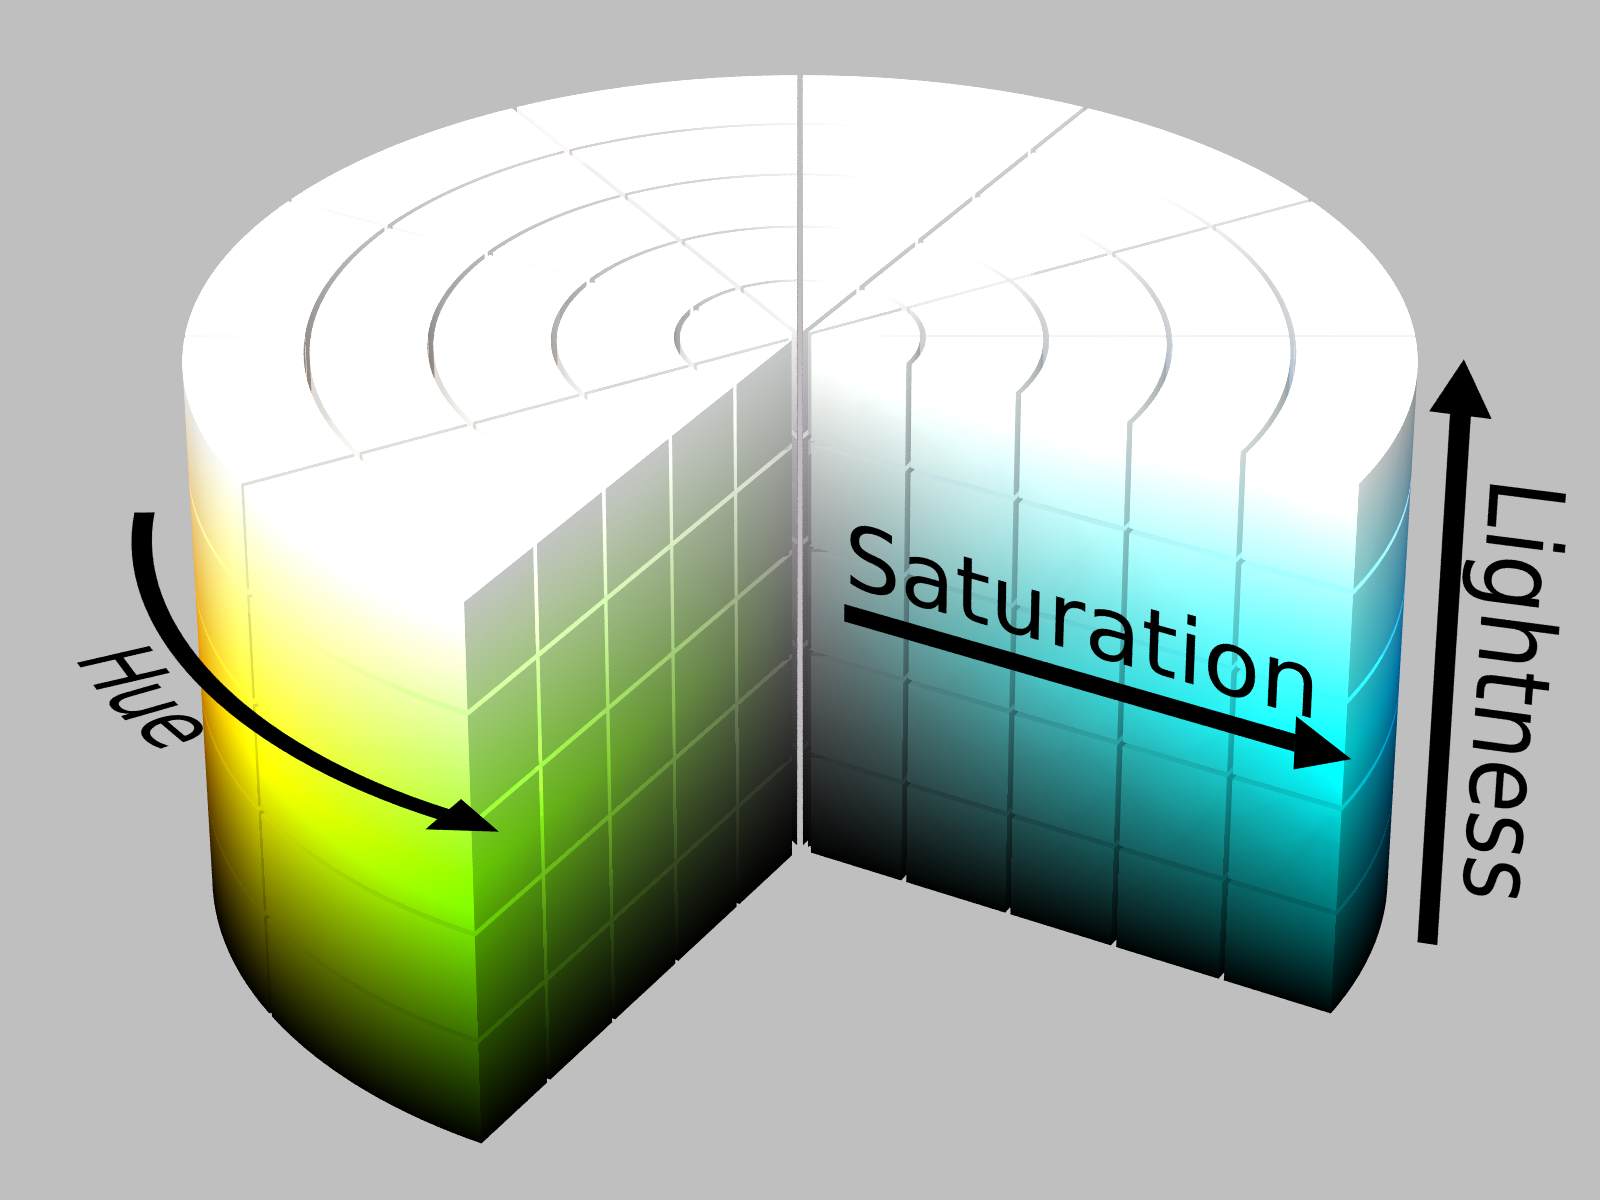 Via Wikipedia user SharkD
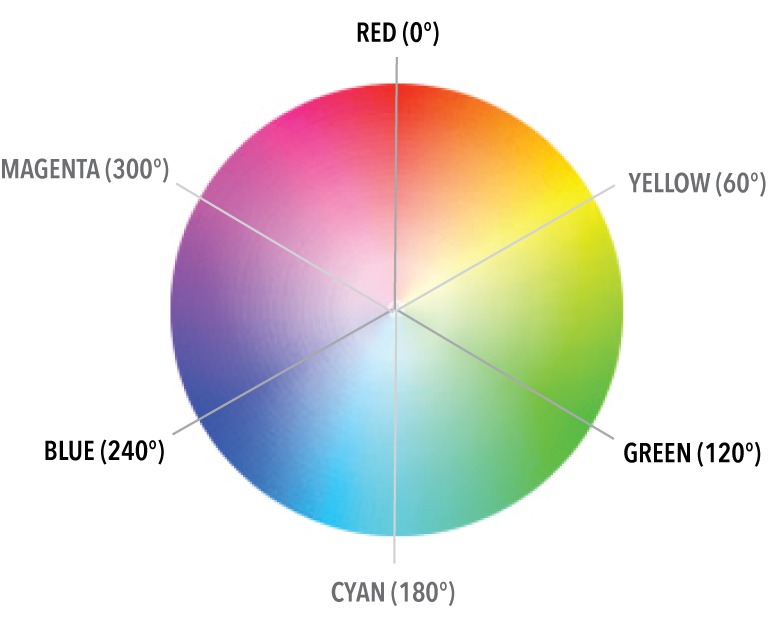
Imagine a particular color as a cube in this cylinder. The closer the cube is to the outside of the circle, the more saturated the color . The higher up the cube, the lighter the color. The hue of the color is represented by the angle around the center of the color wheel, illustrated below. For instance, yellow is at 60 degrees and blue is at 240 degrees.
 Via Dudley Storey
With these three variables, we can plot any color as a coordinate on the color wheel. In our analysis, each pinwheel is based on the color wheel. The wheel is divided into 36 wedges and each wedge is divided into 100 blocks. Our analysis determines which blocks in each slice is most overrepresented relative to the colors across all Instagram accounts. The shade of that slice matches the most overrepresented color; the radius of the wedge represents how overrpresented the color is relative to other wedges.
TL;DR We divided the color wheel up into 3,600 pieces, and looked at what pieces were most overrepresented by each Instagram account.
Data is everywhere!
The analysis and data visualizations in this post were done by our chief analyst Benn Stancil. If you want to look at our dataset in detail, we've made it publicly available on Mode. It includes many other Instagram accounts we didn't feature here, including airlines, beauty products, and celebrities.
There are tons of cool things you can do with this dataset. Dive in to Mode and start exploring!


