8 data exploration tools you need to use in 2024

Shruthi Bezawada, Product Manager
November 2, 2023
NaN minute read

The data landscape has become quite complex in recent years. With data coming from an ever increasing number of sources in greater volume than ever before (with no signs of slowing down), it is easy to lose your way.
The good news? New data visualization and exploration tools empower users to examine their datasets, reveal hidden insights, and identify anomalies, enabling intelligent decision-making. However, not every tool is useful for your analytical needs. In fact, some may create confusion. That’s why it's important to understand how data exploration tools add value to your business and which ones can help you find answers to complex problems.
What is data exploration?
Data exploration is an initial dataset assessment, where teams examine and visualize raw data to understand their patterns. It involves using different tools to understand the size and quality of the data, identify patterns and anomalies, and establish relationships between critical components.
Let’s consider the example of Rumpl. The company didn’t have a unified data infrastructure and relied on siloed platforms for analysis. The disjointed sources made the process of optimizing operations very challenging.
Here’s what Shane Roach Senior E-Commerce Manager at Rumpl has to say about optimizing their operations at Rumpl:
“We wanted to bring everything into one place and get all of our data points to connect.”
By setting up a data warehouse and connecting it to analytics platform Mode, Rumpl was able to access data from a single source and create dashboards and reports within a day. They set their data exploration journey by examining and visualizing datasets and then going deeper with reporting. This helped them reduce the number of support tickets by almost 60%.
Why are data exploration tools important?
Every data professional know the importance of looking at data from different angles. Doing that, however, requires a firmer understanding of your data. This is where data exploration tools come in. Let’s explore how these tools can create an impact.
1. Data cleaning and enrichment
A shocking survey from McKinsey reported that data teams spend 30 percent of their time on non-value-addition tasks because of poor data quality and availability. This calls for a better initiative for refining data quality. Leveraging data exploration tools can help users visualize missing patterns, reveal duplicate data, and identify error entries to create a cleaner and reliable dataset for further analysis.
2. Guiding further analysis
Data exploration allows analysts to identify patterns, trends, and relationships within the data. These insights can guide the formulation of hypotheses about the underlying causes and can be further tested and validated through statistical analysis for better decision-making.
3. Detecting outliers
Outliers are extreme data points in datasets that vary significantly from the expected value. If outliers are not detected, statistical analyses based on the mean and standard deviation can be skewed, leading to inaccurate predictions. Using data exploration tools and visualizations like histograms, scatter plots, and box plots, users inspect the data’s distribution and verify the presence of outliers, leading to better decision-making.
But with so many options, how do you know which one is right for your business? To help you unlock real-time insights, we’ve gathered the best data exploration tools for driving business outcomes and creating an impact.
Date exploration tools you need to leverage for better insights
1. Mode Analytics
Mode’s visualization and exploration capabilities reduce repetitive analytics requests, centralize business logic, and create a shared understanding among the team. The platform allows the team to curate data dimensions and measures to build jumping off points users can confidently spring off into new directions as they explore. With more context and modern cloud ecosystems, organizations can embrace intelligent decision-making that supports both strategic and operational initiatives.
Core features:
Visual explorer
SQL editor
R and Python notebooks
Apply filters and parameters
Iterate with self-serve reporting
In Mode, you can see all your data in a single platform and model it with an intuitive interface to find fresh insights, driving agility and innovation. Sign up for a Mode free trial and discover hidden insights to drive your business further.
2. ThoughtSpot
If you’re looking for a solution that combines the power of AI with a governed search interface, look no further than ThoughtSpot. This BI platform allows you to create fully scriptable data models that you can then analyze with AI and natural language with ThoughtSpot Sage. With these insights, it’s easy to build and share a compelling data story. Best of all, the intuitive, self-service interface is user-friendly for business people of all technical skill levels.

Core features:
Visualizations.
AI+LLM for data exploration
Search-based interface
Auto-analyze with SpotIQ
Sign up for ThoughtSpot’s free trial and experience the difference yourself.
3. Qlik Sense
Qlik’s unified analytics platform is known for its built-in AI and ML capabilities. Its most significant use case includes helping users refine context, make discoveries, and run augmented analytics on large, complex datasets. This BI solution enables you to create visualizations and choose dimensions, measures, and filters to foster better data understanding.
Core features:
AI-assisted data preparation
AI-generated insights
Data cataloging
Collaboration and notes
Interactive dashboards and visualizations
4. Apache Superset
Apache Superset is an open-source data exploration tool built for users to explore data through a simple no-code viz builder or SQL IDE.
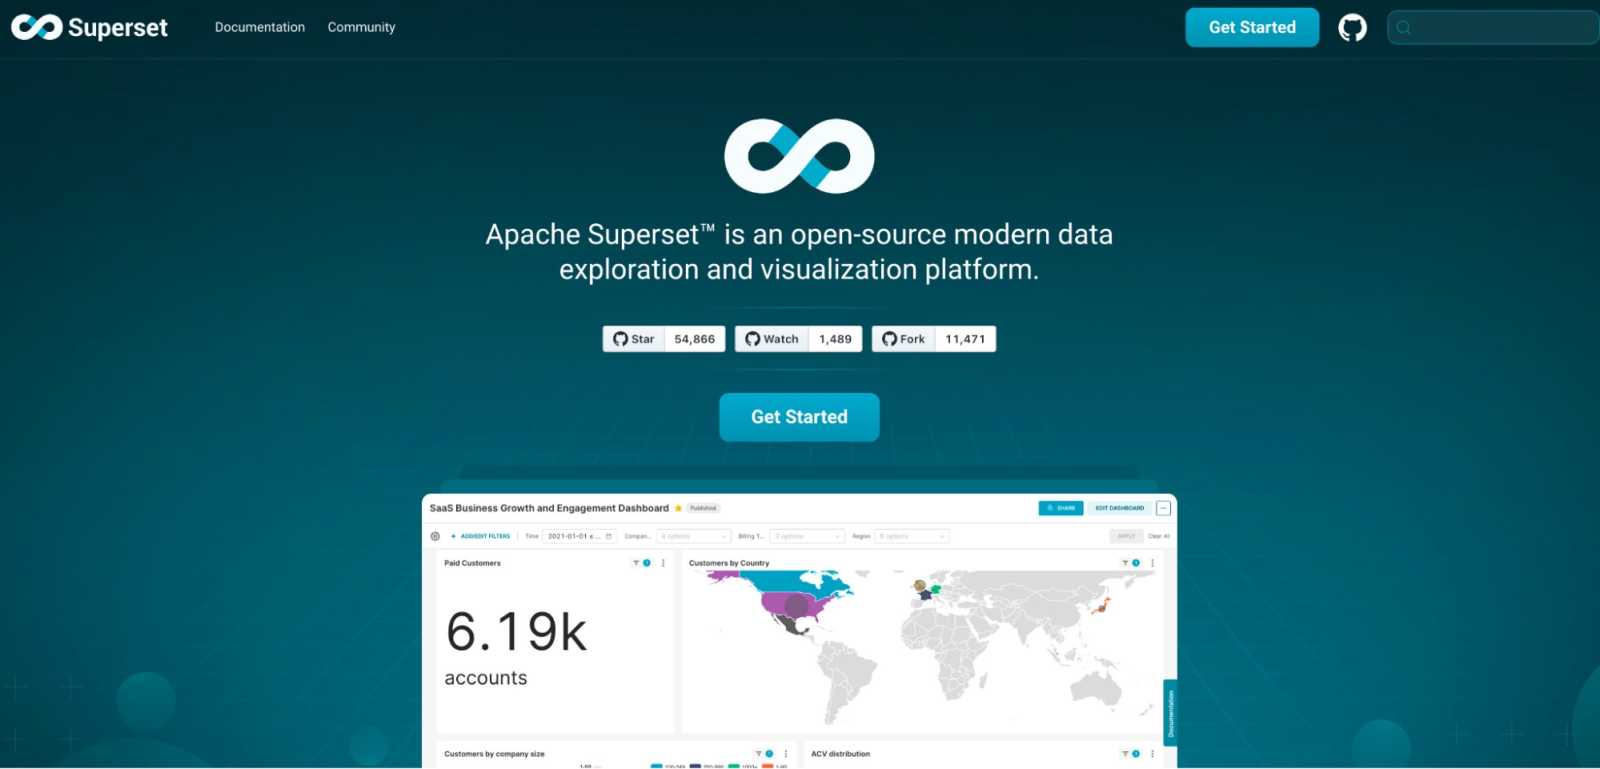
It doesn’t require an additional ingestion layer on top of your existing data infrastructure, instead, it plugs into any SQL-based database directly.
Core features:
Code-free visualization builder
Lightweight semantic layer to define dimensions and filters
SQL IDE for data preparation
In-memory asynchronous caching and queries
API for programmatic customizations
5. Alteryx
Alteryx offers 70+ tools for creating a streamlined analytical workflow. With Alteryx’s low-code visual builder, prescriptive analytics, and AI-infused suggestions, you enrich your data and dig deep into trends and patterns. Users can also visualize raw data to better understand and improve quality with this data exploration tool.
Core features:
Auto insight generation
Data storytelling
Self-serve ETL/ELT
AI-powered analytics
Data exploration and profiling
6. Weka
Waikato Environment for Knowledge Analysis (Weka) is an emerging player in the data analytics space, specifically meant to handle High-Performance Data Analytics (HPDA) workloads at Petascale.
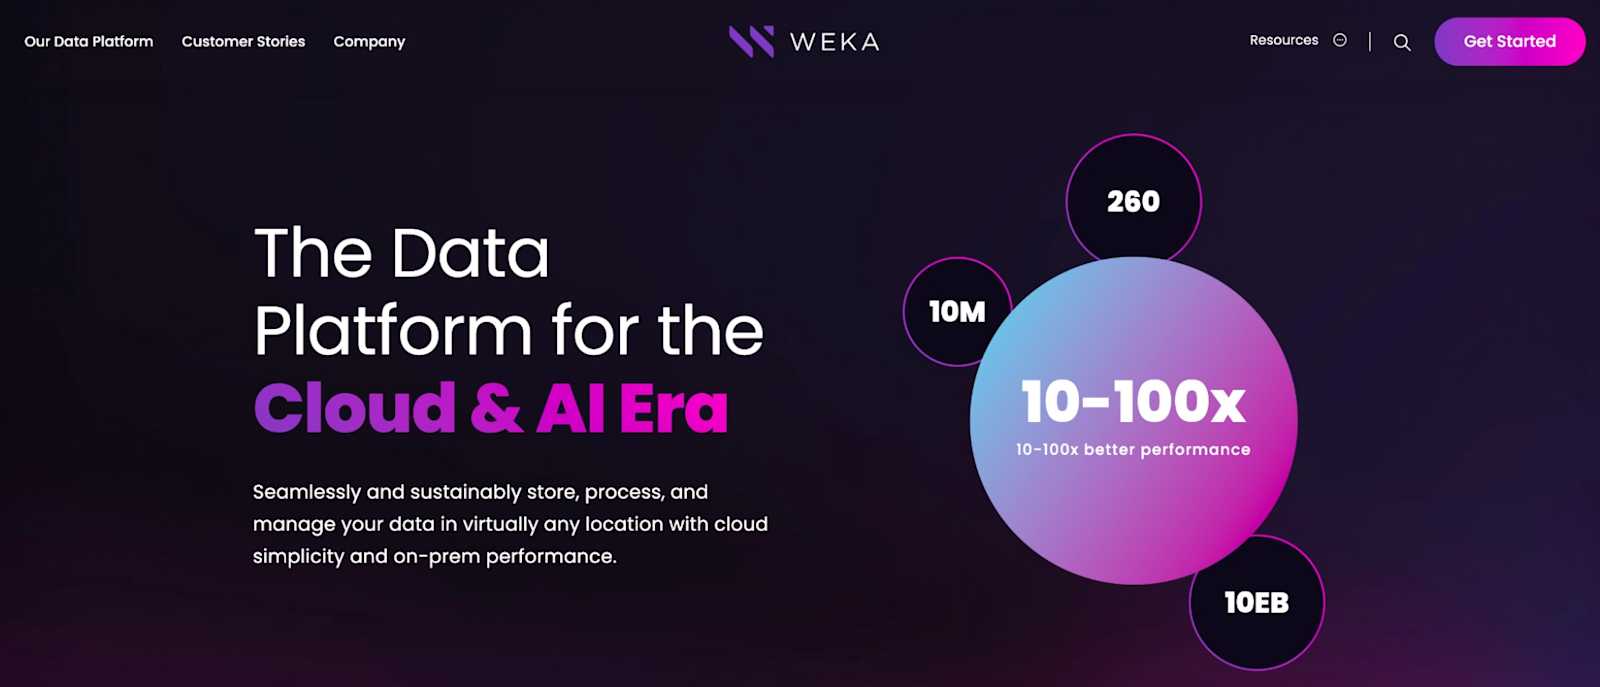
Designed to support structured and unstructured data, Weka has a collection of visualization tools for data exploration, analysis, and predictive modeling.
Core features:
Cloud-native, data center ready
Multi-protocol support
Data storage and visualization
Metadata management
Data protection
7. Looker
Looker is Google’s BI tool that helps users in data exploration and analysis. With Looker, users can connect data from multiple sources, ask relevant business questions, and create visualizations for better understanding. The intuitive interface also allows users to build dashboards and reports to help them stay on top of trends and track critical KPIs. As part of the Google Cloud Products, the platform offers seamless integration with other Google Products.
Core features:
Multiple integrations
AI assistance for data modeling and analysis
Google cloud infrastructure
Ad-hoc analysis
Intuitive user interface
8. OpenRefine
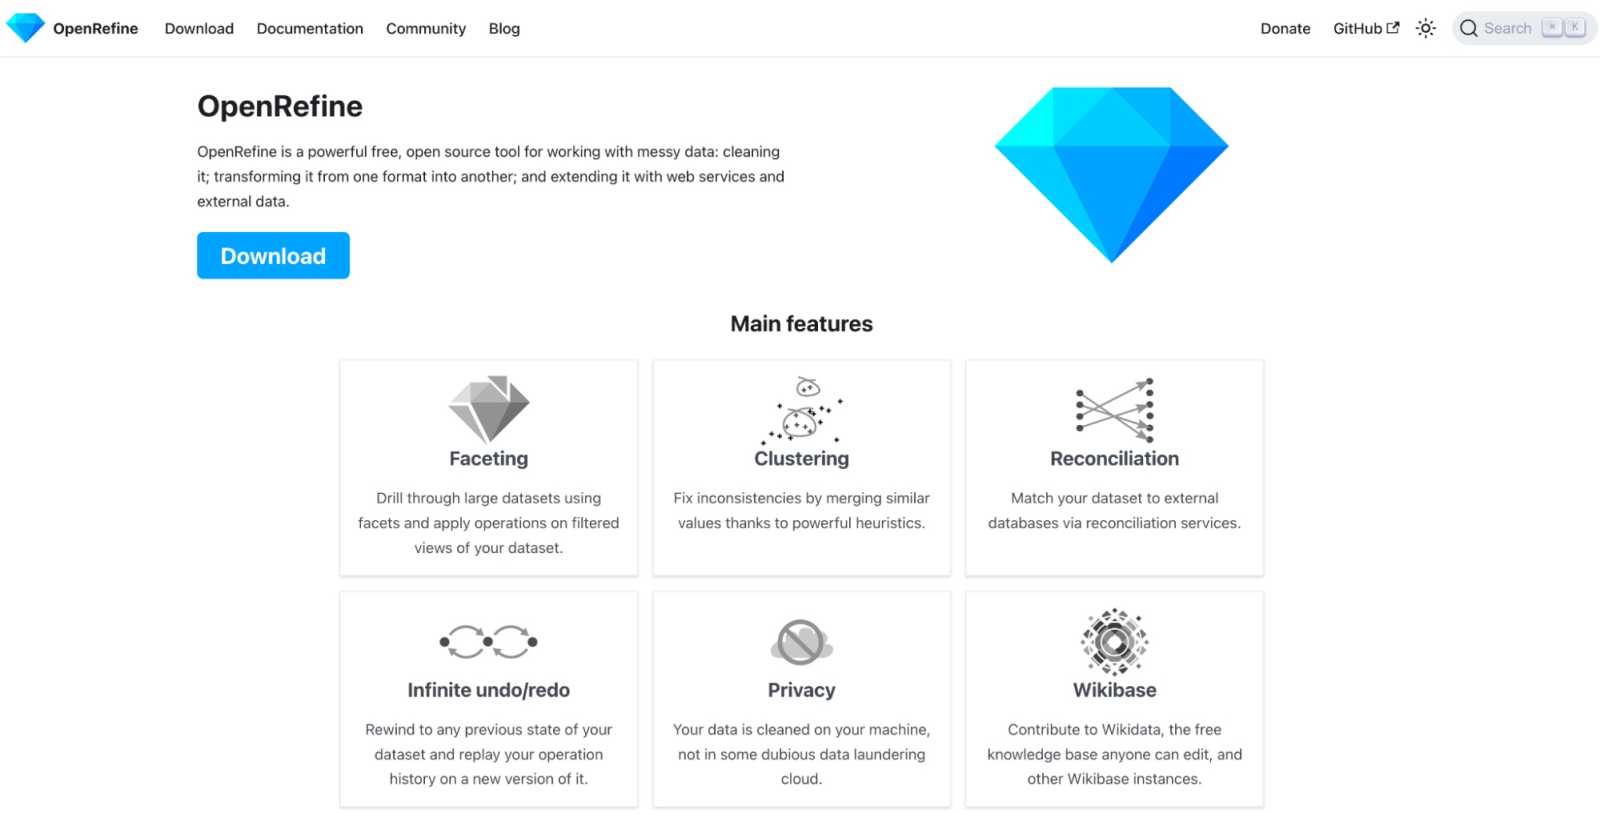
OpenRefine helps business users streamline datasets, remove errors, and integrate them with other databases and applications. It provides an intuitive user interface that corrects errors, detects duplicates, and standardizes formats.
Core features:
Drill through feature for large datasets
Clustering for fixing data inconsistencies
Infinite redo/undo
Match your dataset with an external source
Find and share meaningful insights with your entire team
Each of these data exploration tools offers unique capabilities to manage large datasets and find actionable insights.
As with any data initiative, the key to creating business impact is to align your toolkit with your business strategy. So keep exploring and find new ways to leverage the capabilities of these tools and take your analysis to the next level. And, if you want to experience how Mode’s powerful data exploration capabilities can help your team find the answers they need in real time—sign up for a free trial today.
Get our weekly data newsletter
Work-related distractions for data enthusiasts.


