For the past seven weeks, a corner of the internet has been obsessed with the HBO original series Westworld. Redditors have spent hours crafting elaborate theories, painstakingly searching for clues frame-by-frame, and trying to figure out just who the heck is Arnold.
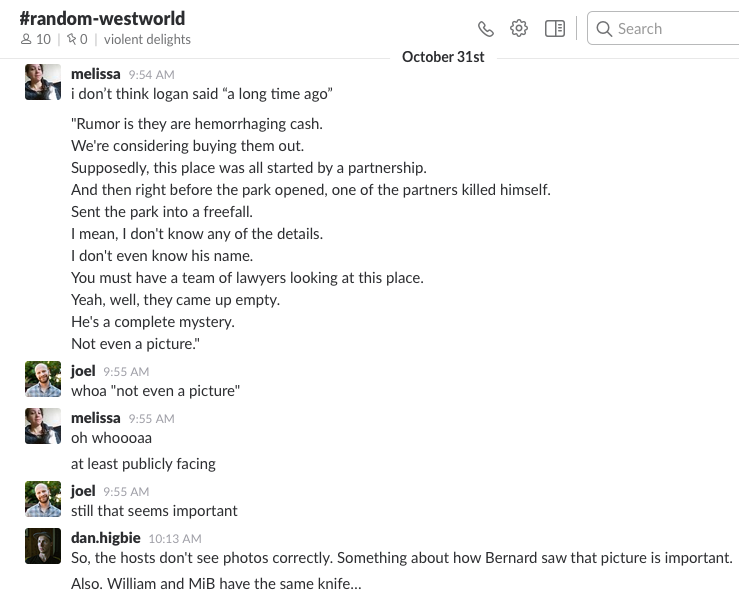
At Mode, some of us were bitten by the Westworld bug early on. We began spending our Monday (and Tuesday and Wednesday) lunches talking about the latest Westworld episode. We created a #westworld Slack channel.
And then, a few weeks ago, Mode had its semi-annual hack day—a 24-hour period during which we're encouraged to put full effort into executing an idea, no matter how crazy. Team “Violent Delights” was born.
There are hundreds, nay, thousands, of Westworld theories out there. But nobody was examining the show from a data perspective—probably because the data wasn't available in a structured format. The first 12 hours of our day were dedicated to manually combing through the scripts from the first five episodes to organize and categorize each and every line into tables. (We've since updated the data to include Episodes 6 and 7.)
With the data prepped, we made charts exploring everything from character relationships to gender parity and built a site to host them.
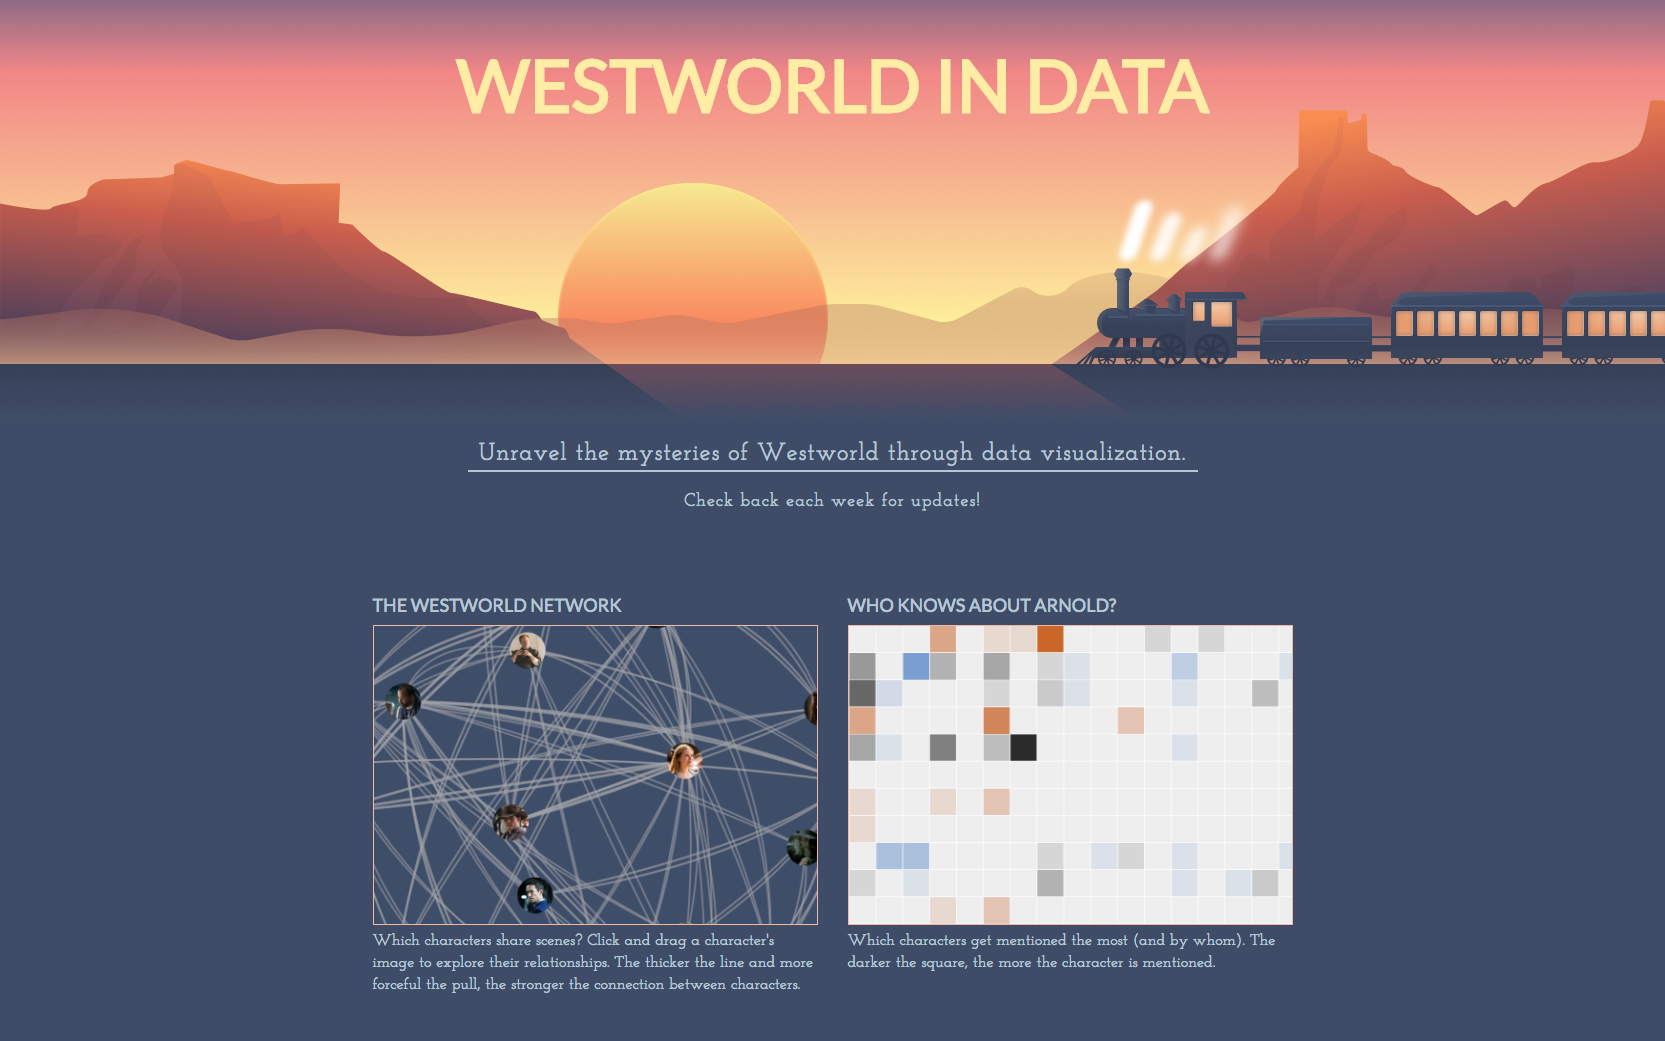
In the weeks following hack day, we spruced the site up for primetime, and here it is: Westworld in Data.
What does the data tell us?
Explore the visualizations for yourself, but here are some of our favorite findings from digging into the data. Spoilers to follow, obviously.
Time periods are bridged by certain characters
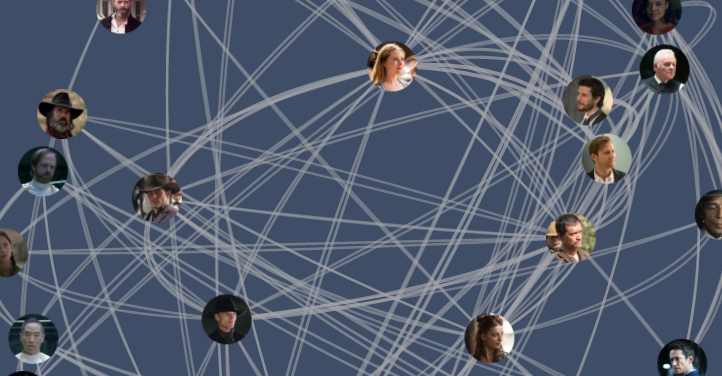
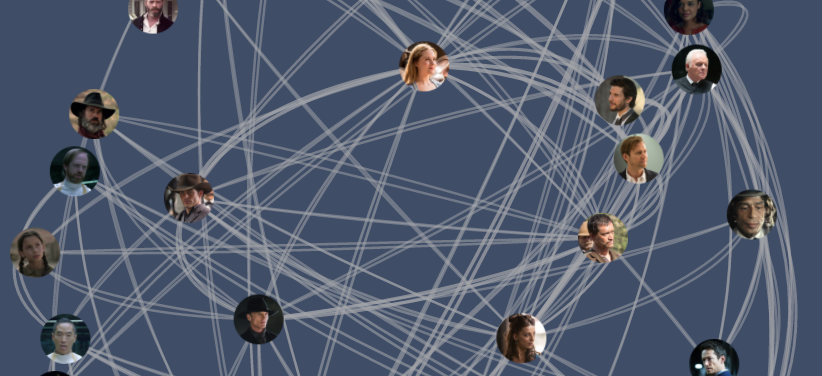
If the multiple time periods theory is true, then Dolores, Lawrence/El Lazo, and Clementine (RIP in cold storage?) are the links between present day and William and Logan's journey in the park 30-ish years ago.
Click the image to see an interactive version of this chart.
Anthony Hopkins is the real star
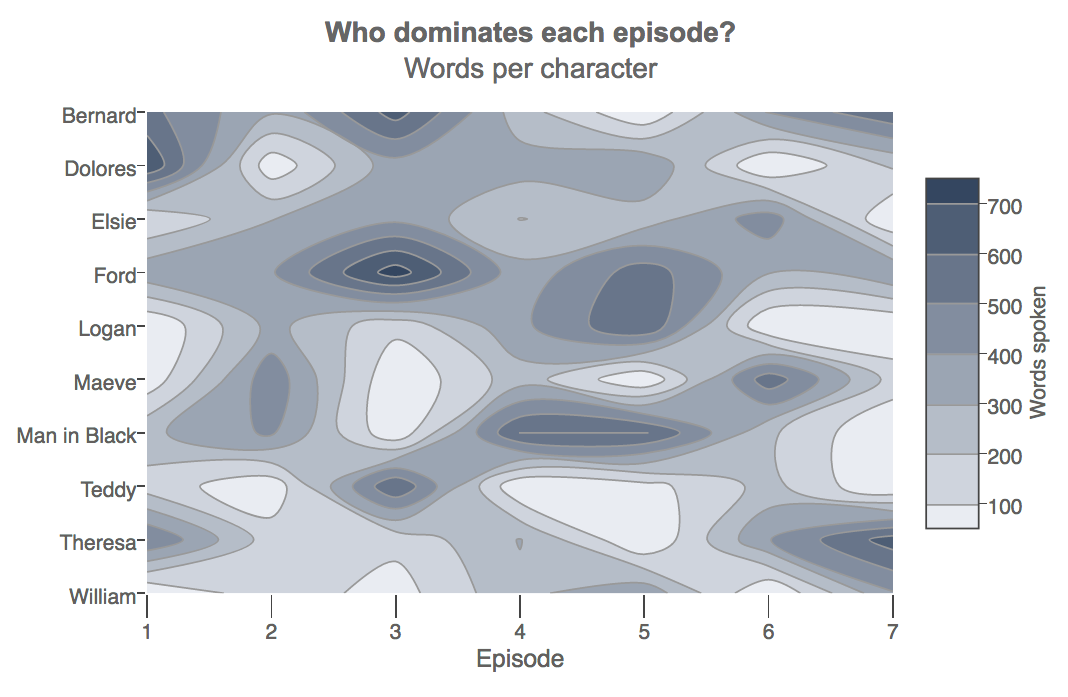
Like Game of Thrones, we go entire episodes without checking in on central characters like Dolores, Maeve, and the Man in Black. But Hopkins' Ford has appeared in every episode so far.
Click the image to see an interactive version of this chart (with more characters!)
Westworld isn't as feminist as it feels
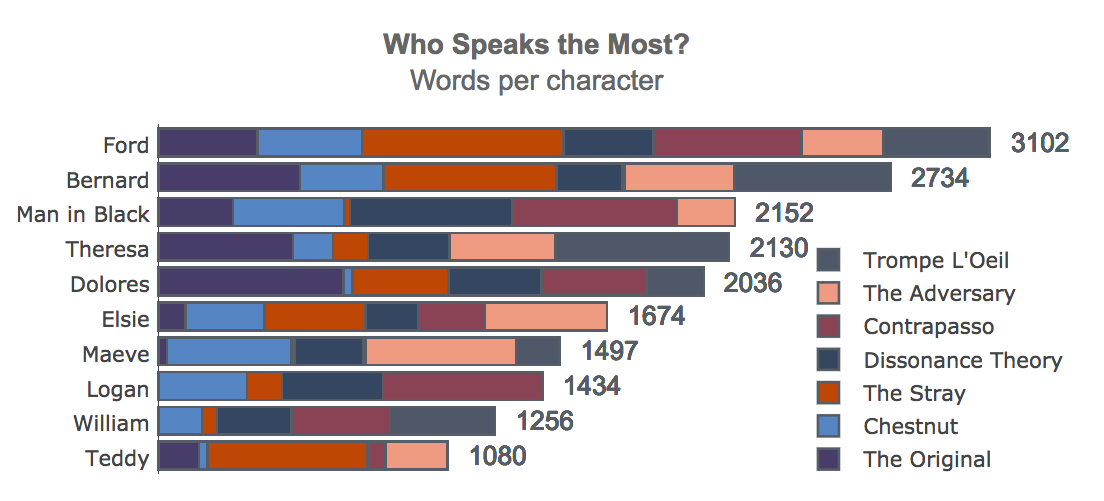
A host uprise is on the horizon, with Dolores and Maeve at the helm. Yet, when we aggregate word count by character, Dolores comes in fifth for most words spoken, and Maeve is seventh. Ford outpaces everyone by a large margin.
Click the image to see an interactive version of this chart.
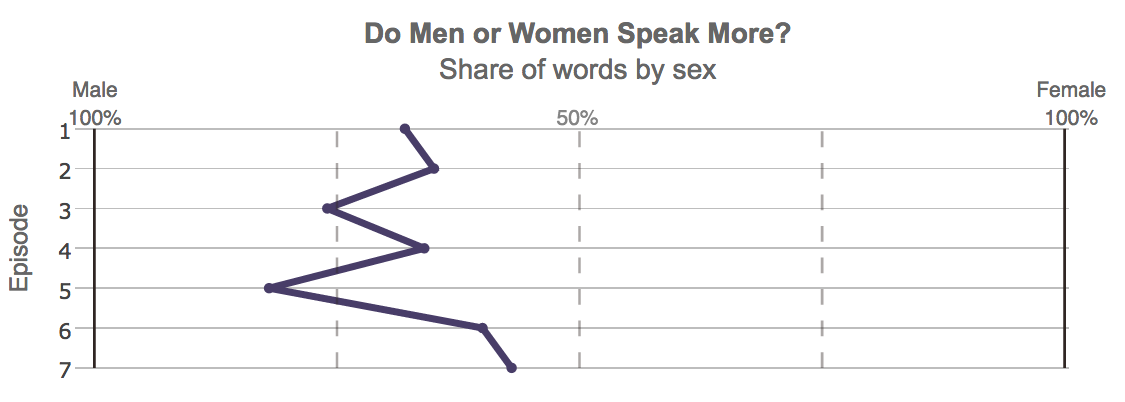
This remains true if you take all characters into account, from the top-billed cast members to the lowliest of one-liners. However, women have been speaking more in the last two episodes.
Click the image to see an interactive version of this chart.
Maybe this trend will continue with Maeve's bump in apperception and Dolores' apparent awakening? Check back each week as we update the visualizations with new scripts.
Prepping the data
We built a dataset using scripts found in the Springfield! Springfield! film and TV script database. Here are the steps we took to prep the data:
- The scripts were missing character names, so it was hard to tell which line belonged to whom. We gleefully rewatched each episode and added the character names in manually.
- Then we set out to create four tables containing information on episodes, characters, lines, and mentions. We assigned each character, line, episode, and conversation a unique id. Other fields included lines, episode names, and word count for each line. Get more details about what each table contains here.
- Once we built the tables, we uploaded the data to the Mode Public Warehouse and created visualizations using a combination of SQL, Python, and D3.
You can access the dataset in the Mode Public Warehouse. Sign up for a free Mode account to export the tables as CSVs or explore them in Mode. If you do analyses of your own, let us know. Send your data viz to westworld@modeanalytics.com and we might include it on the site!
Tune in next week
We'll be updating Westworld in Data with data from the most recent episode every Monday evening, so be sure to bookmark the site and check back. We'll also be doing more Westworld analyses as the season progresses. Sign up for our weekly newsletter to keep up with our data adventures.


