You might not have heard of Eko, but chances are you’ve interacted with their content. Eko has pioneered the medium of interactive video and captured the interest of viewers and national brands alike. Through their proprietary interactive video player, the Eko team weaves rich stories which viewers can navigate on their smartphones, tablets, PCs, and soon VR headsets. The result is a highly engaged audience of viewers, happy advertisers, and a whole lot of data.
Eko’s interactive video player makes it possible for viewers to shape how stories unfold. Viewers are presented with a series of “decision points” throughout a piece of content and the viewer’s subsequent actions determine what happens next on-screen. In this way, the Eko platform provides a unique viewing experience powered by viewer engagement.
If the Eko video player is a machine, clickstream data is its exhaust. Every piece of content Eko produces is instrumented with high-fidelity event tracking. Events are fired actively (i.e. clicks and social shares) and passively (i.e. video buffering and stream quality updates). The result is over 1.3 billion events warehoused in Amazon Redshift, with 50 million more flowing in each month.
Eko uses this event data to track project engagement internally, as well as report on ad viewership for their brand partners. These partners typically like seeing dashboards of their brand’s performance on the Eko platform, so it’s important that Eko’s reporting layer works for both internal and external consumers. And of course, the reporting layer needs to be performant and auditable.
Back when Eko was called Interlude and web videos were still embedded in Flash players, Eko used a clunky and ineffective BI solution for their reporting layer. This solution provided handy mechanisms for sharing specific reports with external stakeholders; however, these reports were often built upon inefficient queries and large swaths of SQL frequently needed to be copy-pasted between reports. The result was slow dashboards, inconsistent data, and unhappy users.
In late 2016, Eko overhauled their analytics stack: They 1) adopted dbt for their data modeling layer 2) switched to Mode Analytics for internal reporting and 3) implemented Mode White-Label Embeds for reporting to external stakeholders.
Data Modeling and Testing with dbt
An essential yet often overlooked piece of the analytics stack is the data modeling layer. For Eko, this layer involves distilling raw clickstream events into rich sessions, updating user attributes with new data, and much more. This denormalization of clickstream data into meaningful business constructs is a major part of the Eko analytics process.
Event sessionization makes it possible for the reporting layer to operate on a few million sessions instead of a few billion events. This leads to two outcomes: 1) reports are blazing fast even for non-trivial queries and 2) complex business logic lives outside of the reporting layer. For Eko, Mode queries are typically thin wrappers around version-controlled, code-reviewed data models defined in a central git repository.
Eko uses dbt (data build tool) to build data models (views and tables), which then power their Mode reports. dbt is an open source tool that many growth stage companies use for data modeling and testing, and—full disclosure—is primarily maintained by my analytics consultancy, Fishtown Analytics.
As the initial data models were being built, we also developed tests to ensure the data was clean. Raw data is often extremely messy, and one of the main purposes of the modeling layer is to clean up any data problems. Testing that the resulting data conforms to certain rules—e.g. referential integrity, not-null fields, and uniqueness—helps to give downstream analysts a strong foundation on which to build subsequent reports.
If you’re curious about data modeling with dbt, check out the repo and come say hello in our Slack community.
Switching to Mode
With their data models in place, Eko was able to make the transition from their legacy reporting solution to Mode Analytics. Mode’s out-of-the-box data visualizations covered about 90% of the existing reports which needed to be ported over. The remaining 10% were covered by the Mode Gallery, and were a snap to set up.
One of Eko’s KPIs, “Reach”, tracks content viewership on a monthly and 3-month rolling average basis. The SQL required to generate this fundamental report in Mode? It’s less than 20 lines.
WITH monthly_views AS (

SELECT DATE_TRUNC('month',mineventtime) AS month,
       COUNT(DISTINCT userid) AS viewers
  FROM analytics.reporting_views
 WHERE content_type = 'Eko'
	 GROUP BY 1

)

SELECT month,
       viewers,
       avg(viewers) over (
         ORDER BY month rows between 3 preceding and current row
       ) AS "viewers - trailing 3 mo"
  FROM monthly_views
 ORDER BY month
During this transition, special attention was paid to “standardized reporting.” Rather than create one report per project (as was the case previously), Eko created general versions of reports that accept a Project ID through Mode’s templated parameters. Now there is a single source of truth for any given metric, users are happy, and data despair is at an all-time low.
Embedding Mode Reporting
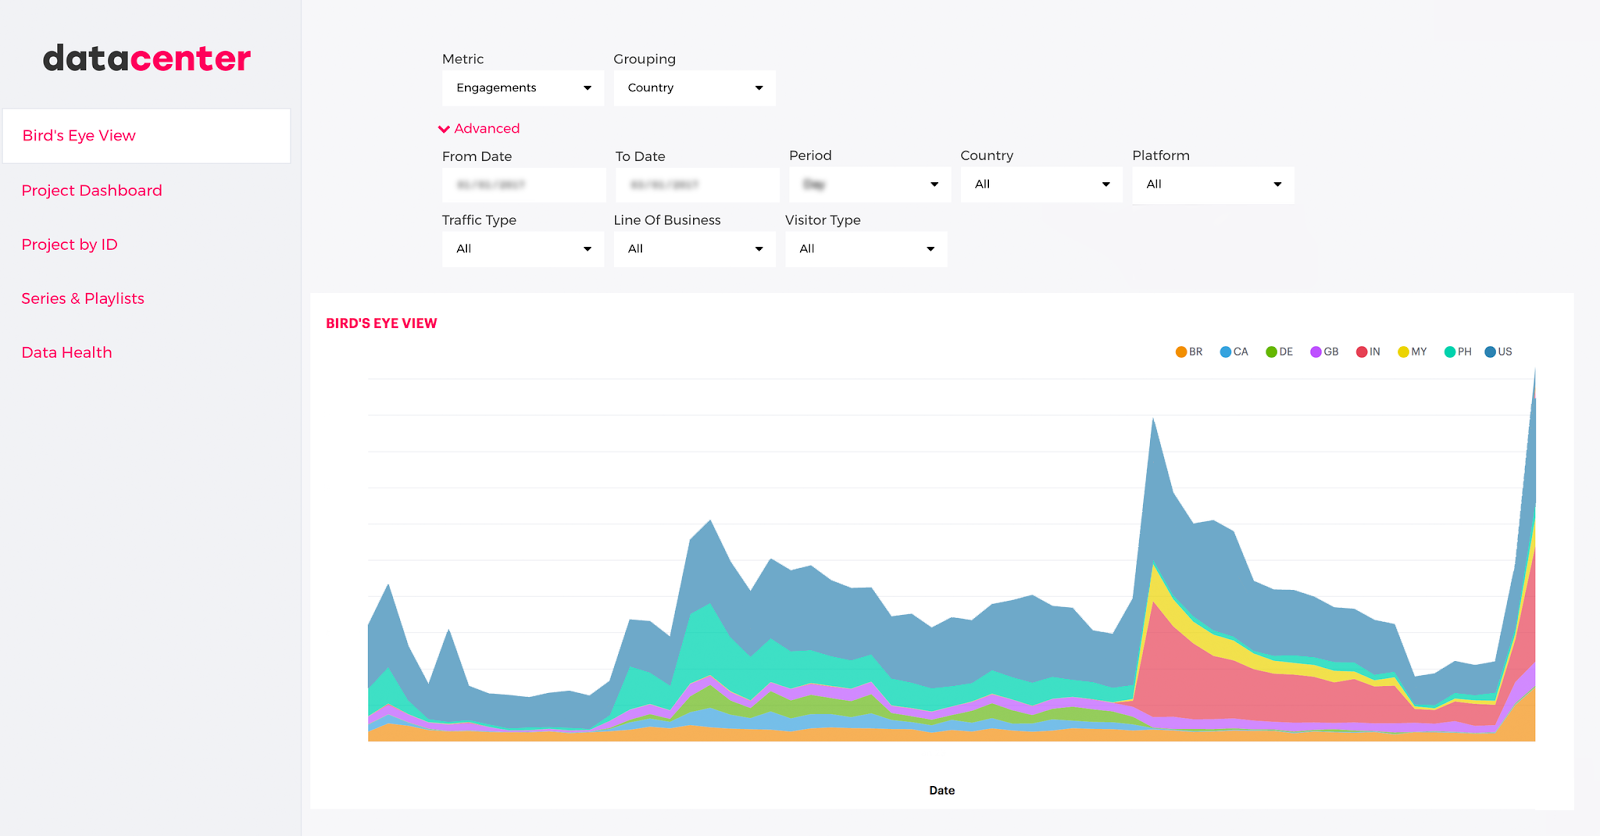
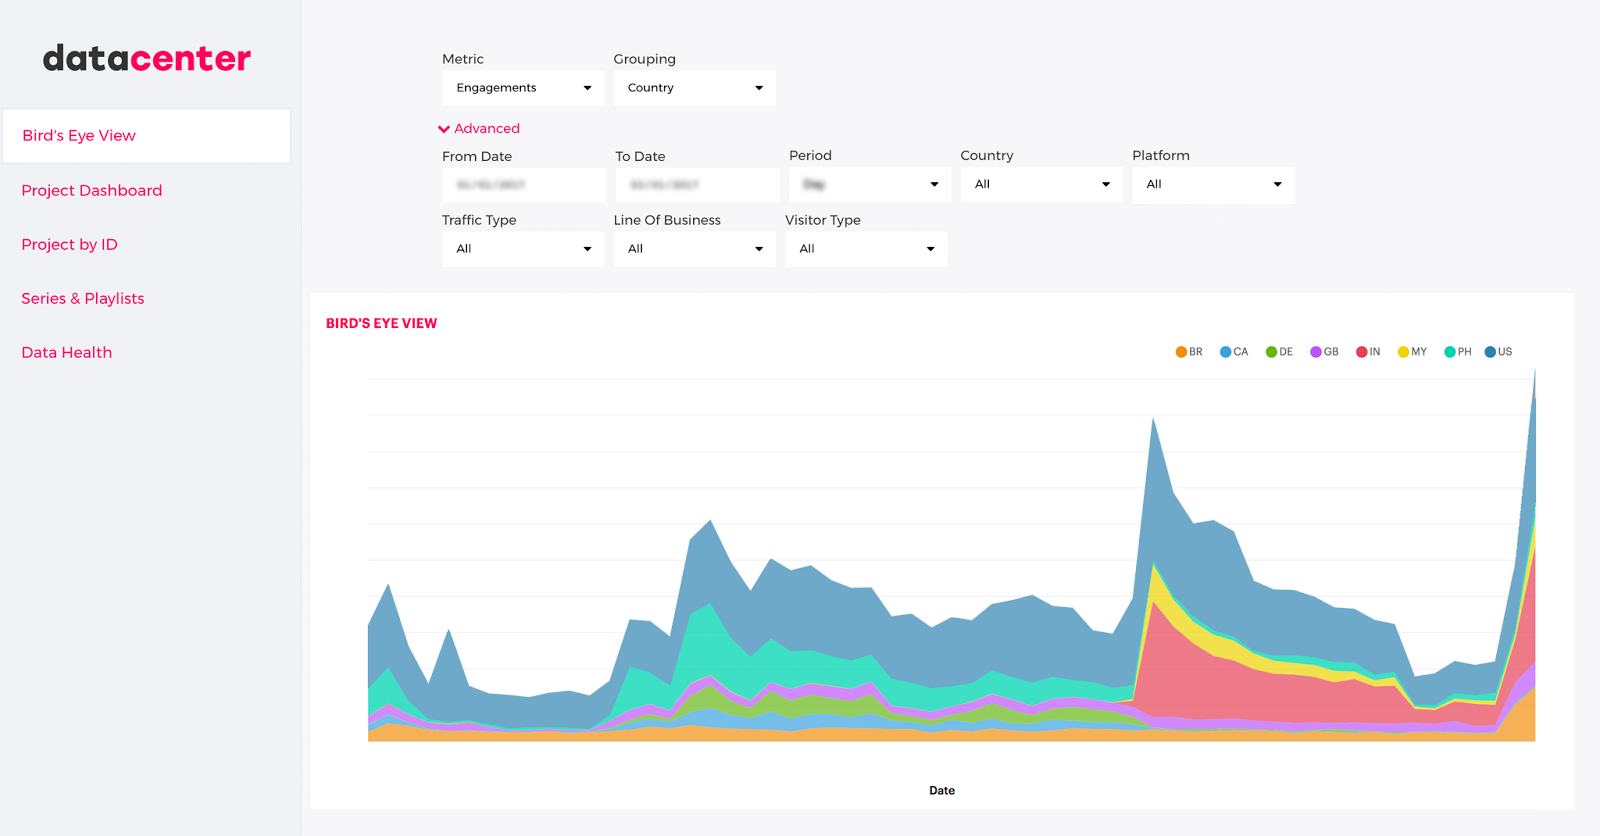
With internal reporting covered, Eko turned its attention to external reporting. Mode’s White-Label Embeds make it easy to securely present reports to external stakeholders. Eko embeds these reports into their password-protected “datacenter” and selectively provides access to brand partners and other stakeholders. Since these reports draw from the same tested, auditable data models as their internal reports, data discrepancies and validity questions are few and far between.

The Future
Previously, much of the analytical horsepower at Eko was needlessly spent on simply keeping the data engine running. The addition of Mode Analytics has freed up Eko’s data team to pursue strategic projects that have historically been perennially backlogged.
Next up, the Eko team will deep-dive into their data to evaluate social virality and understand sophisticated event funnels, likely making use of Mode’s Python Notebook functionality along the way.
About Drew Banin: Drew is a Co-Founder at Fishtown Analytics, an analytics consultancy that helps venture-funded startups build sophisticated internal analytics. We integrate tightly into your org and build scalable analytics designed to take you from 25 to 250 employees. Feel free to drop us a line if you’re interested in learning more.


