


We're gearing up for a season of big feature releases that make it even easier to produce the best analytical work of your career.
This week's new features are based on the insightful feedback from teams of data analysts using Mode to create and share SQL-based analyses with coworkers.
Lists: Organize Your Work
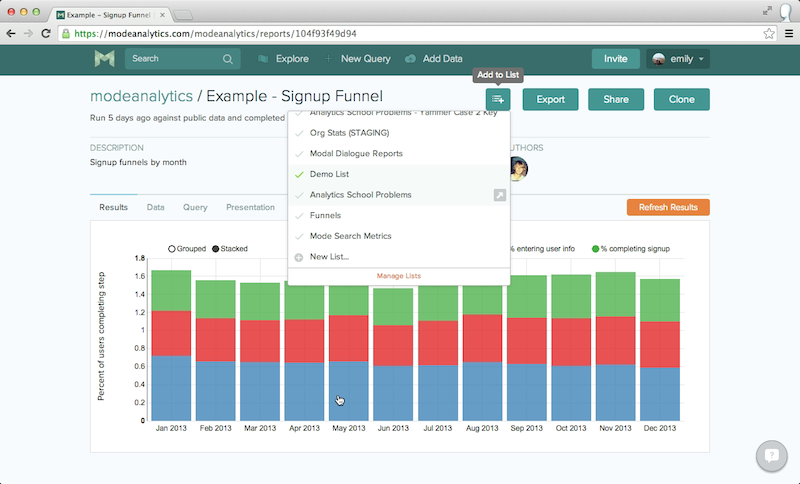
As you create ad-hoc analyses or evergreen reports, keep them organized in Lists. You'll find a new List button next to Export on every report page. Just like reports, lists live at shareable URLs. Now, for example, a Product Manager can bookmark a list you’ve built to measure her product’s success, rather than each and every report.
Dashboards: View and Run Multiple Reports at Once
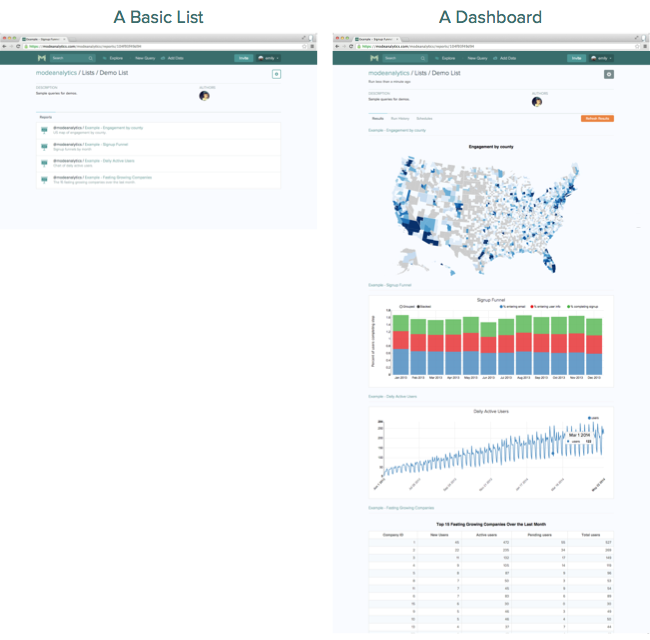
As you create a list, you have options for how it appears: as a Basic List or as a Dashboard. While a Basic List organizes reports and lets you click into each report to run them one by one, a Dashboard is designed to display the results of multiple reports together on one page.
Dashboards + Parameters: Superpowers for Data Consumers
Let's say you've built four reports for your Customer Service Managers to check before quarterly check-in calls with their customers—and you used parameters so they can pull custom stats without touching code (learn more about parameters). Now when you organize these four reports into a dashboard, your CSM can simply enter the customer ID once and click run to execute all four reports.
Report Page Updates
Report Run Times are now displayed at the top of every report so you can see how long the previous run took.

The Data Tab displays a report's raw data. By moving the data to a separate tab, you have more flexibility to create visual reports for dashboards while keeping the data accessible. Of course, you still have the option to show data on the Results tab when creating a report from the Editor.
The Query Tab enables you to switch between the query that generated the results and the raw query. This is a helpful tool for exploring queries that use parameters.
Keep the Feedback Coming!
Many thanks to all of you who chat with us on HipChat, send us email, or ping us in the product to share questions, ideas, and feedback. These updates are in direct response to your great comments. Please let us know what you think about lists, dashboards, and our progress towards making Mode the best place to create and share analytical work.

