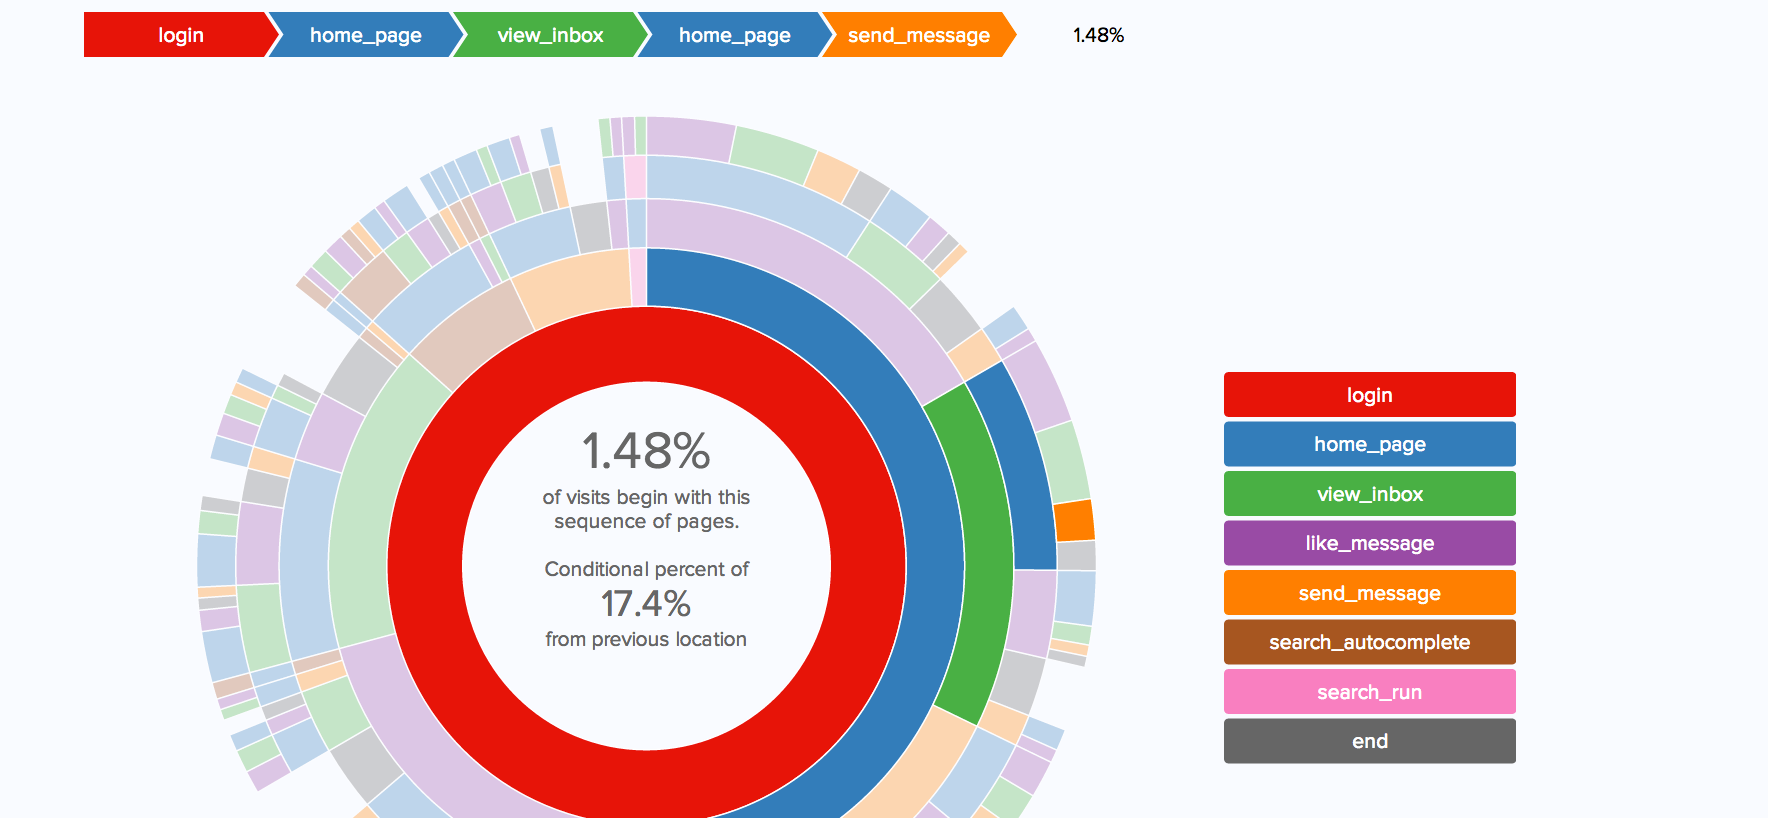
We recently launched the Mode Playbook, a series of open-source SQL queries and visualizations designed to be tailored to common data structures in SQL databases. We wanted to share a bit more about how they came to life, where we hope they go, and how folks have responded so far.
Over the past year, we've had many conversations with analysts about what they want to learn from their data. A lot of companies have similar questions—what drives retention, how customers interact with products, how do we better understand sales pipelines, user lifetime value, and countless other things.
These questions were familiar to us and we'd worked on many of them ourselves. To find answers in our own data, we wrote queries, built reports, and shared visualizations internally. We view the best of the bunch daily while others helped answer critical questions in the moment. Because of these reports, we know more about what our customers are doing, about what is working, and can build a better product and company.
But it soon occurred to us: if we've already done much of the work to answer questions other companies are asking, why should they start from scratch? Software developers rarely build tooltips, or databases, or web frameworks from the ground up; they start with what's been open-sourced and tweak, add on, and extend. Can analytics be the same? Can analysis be open source?
The Mode Playbook is the start of our effort to find out. Each Playbook report includes a SQL query and a visualization. They're built on top of an example users table and event stream—a data structure that's common in many companies. Because users can represent customers, accounts, or users, and events can be logins, purchases, clicks, screen views, or any combination of actions, each Playbook is designed to be flexible enough to fit many different businesses and products. If you have a SQL database with these two concepts, you can make a few simple changes to the reports we provide and have access to the same set of analytical tools we've built over the last year.
At the same time, we know data analysis can never truly be one-size-fits-all. Businesses and products are nuanced and the analytics tools that support them should be, too. Open source tools can provide starting frameworks, but the final analysis needs the adjustments and additions from domain experts—and in nearly every case, that's you, not us. For this reason, we expose every step our analysis, starting with the raw SQL query. This not only makes data manipulations and aggregations completely transparent, but also makes them infinitely customizable. In cases where we've added a custom chart, we also provide the HTML, CSS, and Javascript code that powers it, enabling the same level of flexibility for the visualizations.
Beyond providing queries and code, we hope a repository like this can provide ideas. Our conversations with other analysts have shown us new ways to approach old questions; we never would have come up with some of our methods without this inspiration. By open sourcing our code, we hope that we can also open source new ways of thinking about retention, growth, sales, and other areas of analysis.
But we know we didn't get everything right. Other methods could be more insightful and lead to clearer actions; our queries could be smarter, more efficient, and more robust; our visualizations could be made more engaging and dynamic; and god help our CSS. Some folks have already helped out: analysts at Twitch added additional metrics to our visualization that tracks how users move through your site, while Munchery helped us cut 20 lines out of our retention query.
We're very grateful for these contributions—and hope it's just the beginning. To make it easier for others to share their ideas, we've also added all the source code to GitHub. If you have comments, suggestions for improvements, requests for additional reports—or best of all, analysis that you too would like to open source—we'd love to hear from you, either on GitHub or at hi@modeanalytics.com.
Of course, unlike open source software, analysis is usually dependent on proprietary data. But this shouldn't be a barrier to sharing methods, ideas, and best practices. We've built all of the reports on randomly generated users and events tables that mimic the structure of real data. For anyone interested in open sourcing work built on a different data structure, let us know and we'll be happy to help.
These reports are just our first step. We're already working on opening up other internal projects we've done on growth, A/B testing, SaaS finance metrics. As we grow, we'll undoubtedly have more questions to dig into, as will thousands of other companies. By sharing ideas, we hope we can turn these question into answers—and not just for us, but for anyone with a few tables and a bit of curiosity.
We're excited to see where it goes.


