4 Handy SQL Tips for Pivot Tables
Jennifer Chu, Support Analyst
February 28, 2017
NaN minute read

Update: In Mode, you are now about to make pivot tables code-free! No SQL required.
Learn how to make pivot tables code-free in Mode. See our Visual Explorer Field Guides for more chart types.
Mode's SQL-powered pivot tables are designed to give everyone the ability to instantly explore shared data sets. But a pivot table is only useful if its underlying data is clean and structured.
Let's dig into a few SQL best practices for creating data sets optimized for pivot tables.
Simplify your queries and let pivot tables do the work
Use Mode pivot tables to drag and drop columns from your query results and calculate COUNT, SUM, MIN and MAX, and AVG on the fly.
This will save you from calculating everything in SQL. Without a pivot table, an analyst working for a paper company might write a query like the one below to aggregate sales of each paper type, by customer:
SELECT a.name,
    SUM(o.gloss_qty) AS gloss_qty,
    SUM(o.poster_qty) AS poster_qty,
    SUM(o.standard_qty) AS standard_qty,
    SUM(o.total) AS total_qty,
    SUM(o.gloss_amt_usd) AS gloss_amt_usd,
    SUM(o.poster_amt_usd) AS poster_amt_usd,
    AVG(o.poster_amt_usd) AS avg_poster_amt_usd,
    SUM(o.standard_amt_usd) AS standard_amt_usd,
    AVG(o.poster_amt_usd) AS avg_poster_amt_usd,
    SUM(o.total_amt_usd) AS total_amt_usd
  FROM demo.accounts a
  JOIN demo.orders o
    ON a.id = o.account_id
    GROUP BY 1
    ORDER BY 1
SUM(o.poster_amt_usd) AS poster_amt_usd,
    AVG(o.poster_amt_usd) AS avg_poster_amt_usd,
    SUM(o.standard_amt_usd) AS standard_amt_usd,
    AVG(o.poster_amt_usd) AS avg_poster_amt_usd,
    SUM(o.total_amt_usd) AS total_amt_usd
  FROM demo.accounts a
  JOIN demo.orders o
    ON a.id = o.account_id
    GROUP BY 1
    ORDER BY 1
The query returns one row per customer. Instead, you could write a simpler query that pulls all the order data, returning one row per order:
SELECT a.name,
   o.gloss_qty,
   o.poster_qty,
   o.standard_qty,
   o.total,
   o.gloss_amt_usd,
   o.poster_amt_usd,
   o.standard_amt_usd,
   o.total_amt_usd
  FROM demo.accountsa
  JOIN demo.orders o
    ON a.id = o.account_id
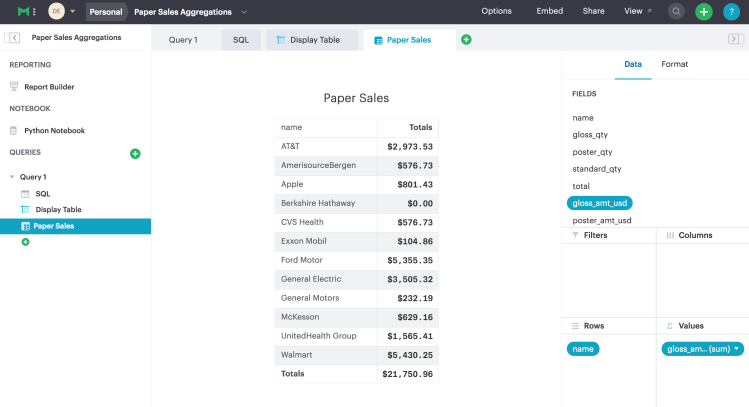
And add a pivot table to calculate the totals:
There are trade-offs, of course. The first query allows you to display all of the summarized data at once, whereas the second query provides a more explorable dataset.
As you write your queries, think about the use case for your report's recipient. Rather than write your SQL query to answer a specific one-off question, write your query in a way that allows your teammates to explore on their own using pivot tables. This way, you won't have to continually modify your query to address follow-up questions, freeing you up for more exploratory analysis.
Removing duplicate data
You may need a bit of data wrangling to transform data into consistent formats (and ensure you do not have unintended duplicate rows as a result).
A common example of this problem arises when analyzing web page visits. If you were working to aggregate traffic by page, and your marketing team is using a variety of UTM parameters to classify traffic, you might need to clean this data up using a variety of SQL string functions.
Here's a very simplified example using sales rep names. Let's say you have two tables: one in which the reps names are stored as a combination of first and last name, and a second table in which the reps' names are saved as a first name and last name column. If you were to join the two tables together, without any clean up, you'd end up with rows of duplicate data and nulls.
split_part(name, ' ', 1) can be used to extract the first name of the rep from the first table, setting up the data to be joined with the second table. split_part is just one of many SQL string functions that are helpful for cleaning data.
Fleshing out date attributes
Since a wealth of information can be stored in a single timestamp column, it can be useful to isolate date components for faster rollups. More specific columns will provide better filtering options in your pivot table.
For example, you want to explore annual, monthly, and weekly, sales trends. If you are accustomed to pivoting in Excel, you are probably familiar with using Group or Ungroup to rollup up dates.
With sales orders listed with a complete date field timestamp, i.e. YYYY-MM-DD hh:mm:ss, you are limited to what you can pivot on. With SQL, EXTRACT or DATE_TRUNC functions can isolate subfields in your date column and provide a variety of units of time others can use to explore the data set— in this case year, month, and day. To use specific parts of a timestamp, feed it into the EXTRACT(‘[interval]’FROM timestamp) function.
SELECT occurred_at,
  EXTRACT ('year'FROM occurred_at) ASyear,
  EXTRACT('month'FROM occurred_at) ASmonth,
  EXTRACT('day'FROM occurred_at) ASday,
  total_amt_usd
  FROM demo.orders
  WHERE occurred_at >='2015-12-15 12:00:00'AND occurred_at <='2016-01-15 12:00:00'
The query returns columns that allow more useful pivoting than the occurred_at column alone:
Give It a Try!
Follow this guide to create a pivot table in Mode and get started!
Let us know if you have questions or feedback at hi@modeanalytics.com or reach out to us by opening a chat right in the product. We love hearing from you!
Get our weekly data newsletter
Work-related distractions for data enthusiasts.


