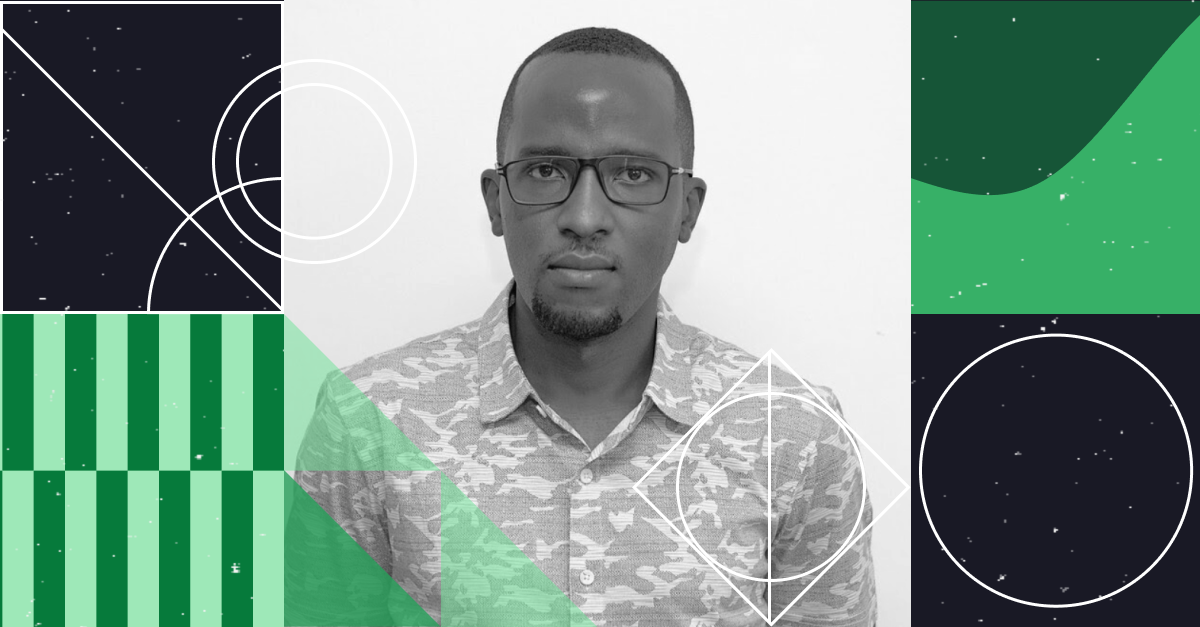
Who’s Behind the Numbers? A Conversation with Hassan Kibirige, Creator of Plotnine

Chioma Dunkley, Mode Team Writer
March 8, 2022
NaN minute read

This is our second installment of the series “Who’s Behind the Numbers?.” With this series, we’ll be interviewing data professionals to not only get a view into what they do, but to also learn about their journey and who they are to show that there is not one type of person or path for this field.
We want to know who is behind the numbers: Who are the people creating the dashboards, visualizations, and pipelines to get us the data that we use to inform our decisions? What’s their story? What’s their why? We hope that these conversations will inspire others and increase representation in the field.
We are excited to continue this series highlighting Hassan Kibirige, creator of the python visualization library Plotnine, to hear more about his story and the story behind Plotnine.
Can you tell me a little bit about yourself? (Your background, your experience in tech, whatever you wish to share here, etc)
I was born and raised in Kampala, Uganda. My educational background is in computing and physics. I work for A-Plus Associates, a small business consultancy in Uganda. My work is varied and includes business process development, installation of off-grid agro-technology equipment, and field-team support.
What drew you to tech?
I am drawn to technology because it is powerful and seems to have limitless possibilities. There is always some potentially new capability or application to think about or dream about, and within this space, there is plenty of room to try with little consequence for failing.
"I am drawn to technology because it is powerful and seems to have limitless possibilities."
Tell me a bit about the data visualization library Plotnine. (Your inspiration for creating it, how you'd describe it, what you feel are the benefits of it.)
Plotnine implements what is known as "The Grammar of Graphics" in the Python programming language. This is a structured way to describe the pieces that make up a graph. I was inspired by ggplot2 which is an implementation of the Grammar of Graphics by Hadley Wickham in the R programming language.
A "Grammar of Graphics" system like Plotnine gives you a concise language with which to create a plot. It also allows you to build more complicated plots piece by piece. These aspects make it an indispensable tool for exploring and analyzing data.
What was the process like creating it? (How long did it take to create, difficulties faced, your favorite things about creating it, etc.)
I discovered this "Grammar of Graphics" thing and found it elegant and powerful. So, I wanted to be able to use it in Python, my preferred programming language for data analysis. I read the key text on the subject by Leland Wilkinson and while I had a good grasp of it, translating it into a usable system would have been a huge undertaking. Hadley Wickham had done so for his doctorate and came up with ggplot2. While I was not confident enough to take this on, I felt that it was quite revolutionary and someone was going to implement it for Python.
And it happened—a project came up that allowed people to seemingly make plots in Python using a grammar just like ggplot2. I started using it but soon discovered that it did not implement a grammar, it just faked one, and it broke down when you tried to make more complicated plots. Since this project was open source, I contributed to improving it. Yet to fix what was lacking grew into a complete overhaul, and this endeavor is what became Plotnine. The first release of which came out in July 2017 after about 3 years of on-and-off development.
To my surprise, Plotnine has been more successful than I imagined. For it, I have twice received the Google Open Source Peer Bonus Award—a recognition from Google employees towards open source software that is essential to their work. I have helped someone who was working on a COVID-19 vaccine trial solve a small problem they had run into with Plotnine. And, there is a book or two about it.
Besides, Plotnine does not exist in isolation, it depends on, and is used alongside other scientific computing libraries. Over time, I have made small contributions to some of these libraries which has been a very gratifying experience. For example, I have contributed to Matplotlib, which in 2019, was used to create the first-ever image of a black hole.
There have been some challenges, the biggest being to find enough quality time to commit to the project.
Who or what inspires you?
When I was growing up, the narrative was that the white man was the only innovator in science and technology. The white man invented the aeroplane; the white man went to the moon; the white man made the all-intelligent machine (computer) and so on. In this environment, I could never see myself as part of any cerebral effort beyond our national boundaries. With time, I came to realize that this narrative was flawed and that we lived in a time of really fast change that coupled with slowly vanishing international boundaries.
"With time, I came to realize that this narrative was flawed and that we lived in a time of really fast change that coupled with slowly vanishing international boundaries."
To have overcome that crippling mentality has inspired me with the notion that there may be other thoughts and perceptions I need to change or even new ideas that I can explore.
What are some of the things you enjoy doing in your spare time?
My work does not involve programming, so I do that in my spare time. I also enjoy reading, and I am slowly picking up photography.
What advice would you give to people of color in technology?
If you are thinking about getting into technology, it is a broad field, and you should find out what the options are. When possible, you should explore the options and do not fear that you will fail.
Anything else you would like to share?
Trivia: The name Plotnine takes its form from an old and gloriously bad movie called "Plan 9 from Outerspace." The plot includes a plan to control the future of the human race which tends to intrigue me, but the movie is so terribly made yet it is comical and memorable. Plotnine, abbreviated as p9 which was not exactly planned out as such, pays homage to that contrast.
Thank you Hassan Kibirige for taking the time to share your story with us. We hope that it inspires others to explore all that’s out there.
Interested in hearing more stories? Check out our first installment of this series.
Get our weekly data newsletter
Work-related distractions for data enthusiasts.


