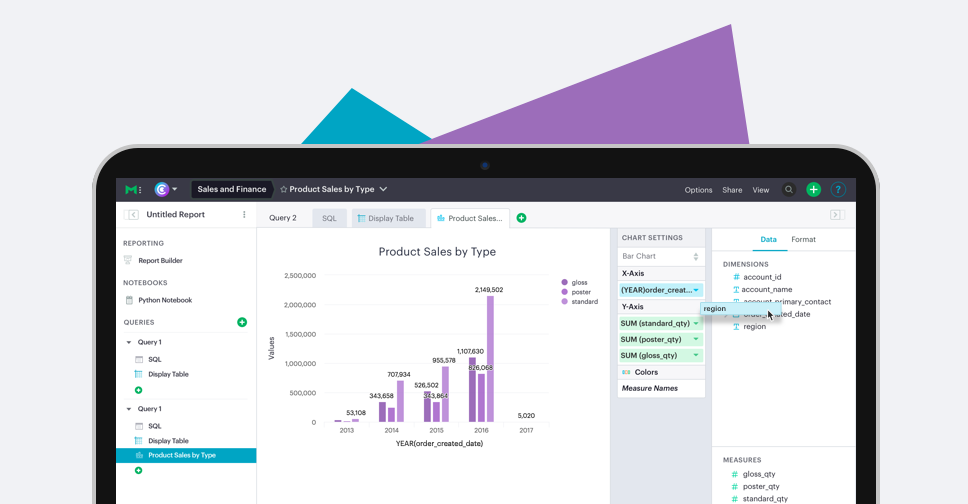
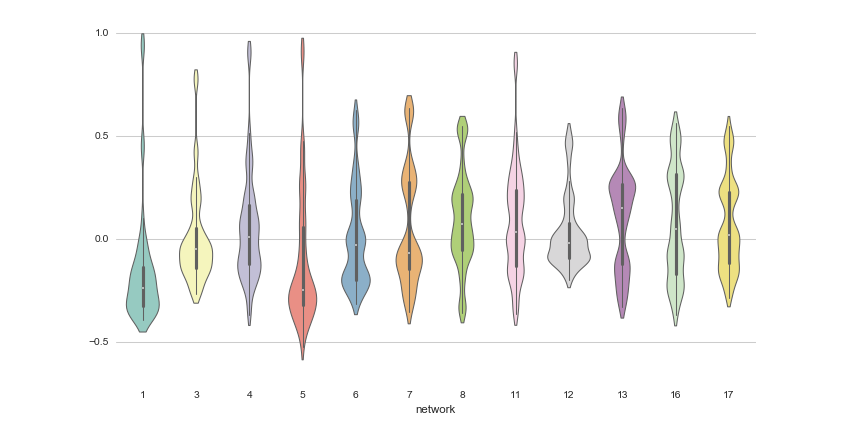
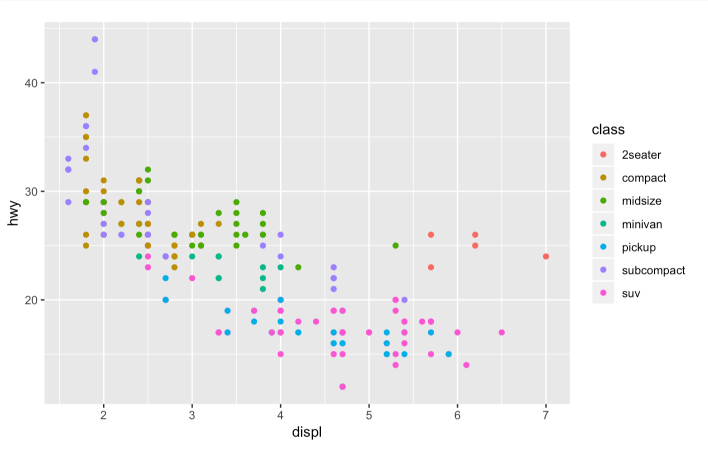
Phase II of this summer's code-free data exploration rollout is now live: drag-and-drop data exploration.
There's a whole new world of data analysis tools at your fingertips. New Mode charts let analysts shift heavy lifting during exploratory analysis away from SQL and into visual tools. With the option to explore data with less code, more people can collaborate to find answers more quickly.
It all starts with simpler queries that result in disaggregated data sets. The new chart builder performs date math and aggregations on the fly as you drag fields into the drop zones. The new chart builder also introduces dozens of fixes and improvements to chart basics, making it easier to present high-impact work throughout your organization.
While you can continue to share specific ad hoc answers with colleagues, opening up more of the underlying data set along with answers can deepen collaboration. Everyone in your organization can instantly access the visual exploration tools, just by clicking on a chart. By abstracting away the code, everyone is free to explore the adjacent questions that spark new ideas.
With routine self-serve analysis happening right alongside code-first analysis on the frontier of an organization's data, data teams and domain experts can partner to break new analytical ground like never before.
Company-Wide Data Exploration
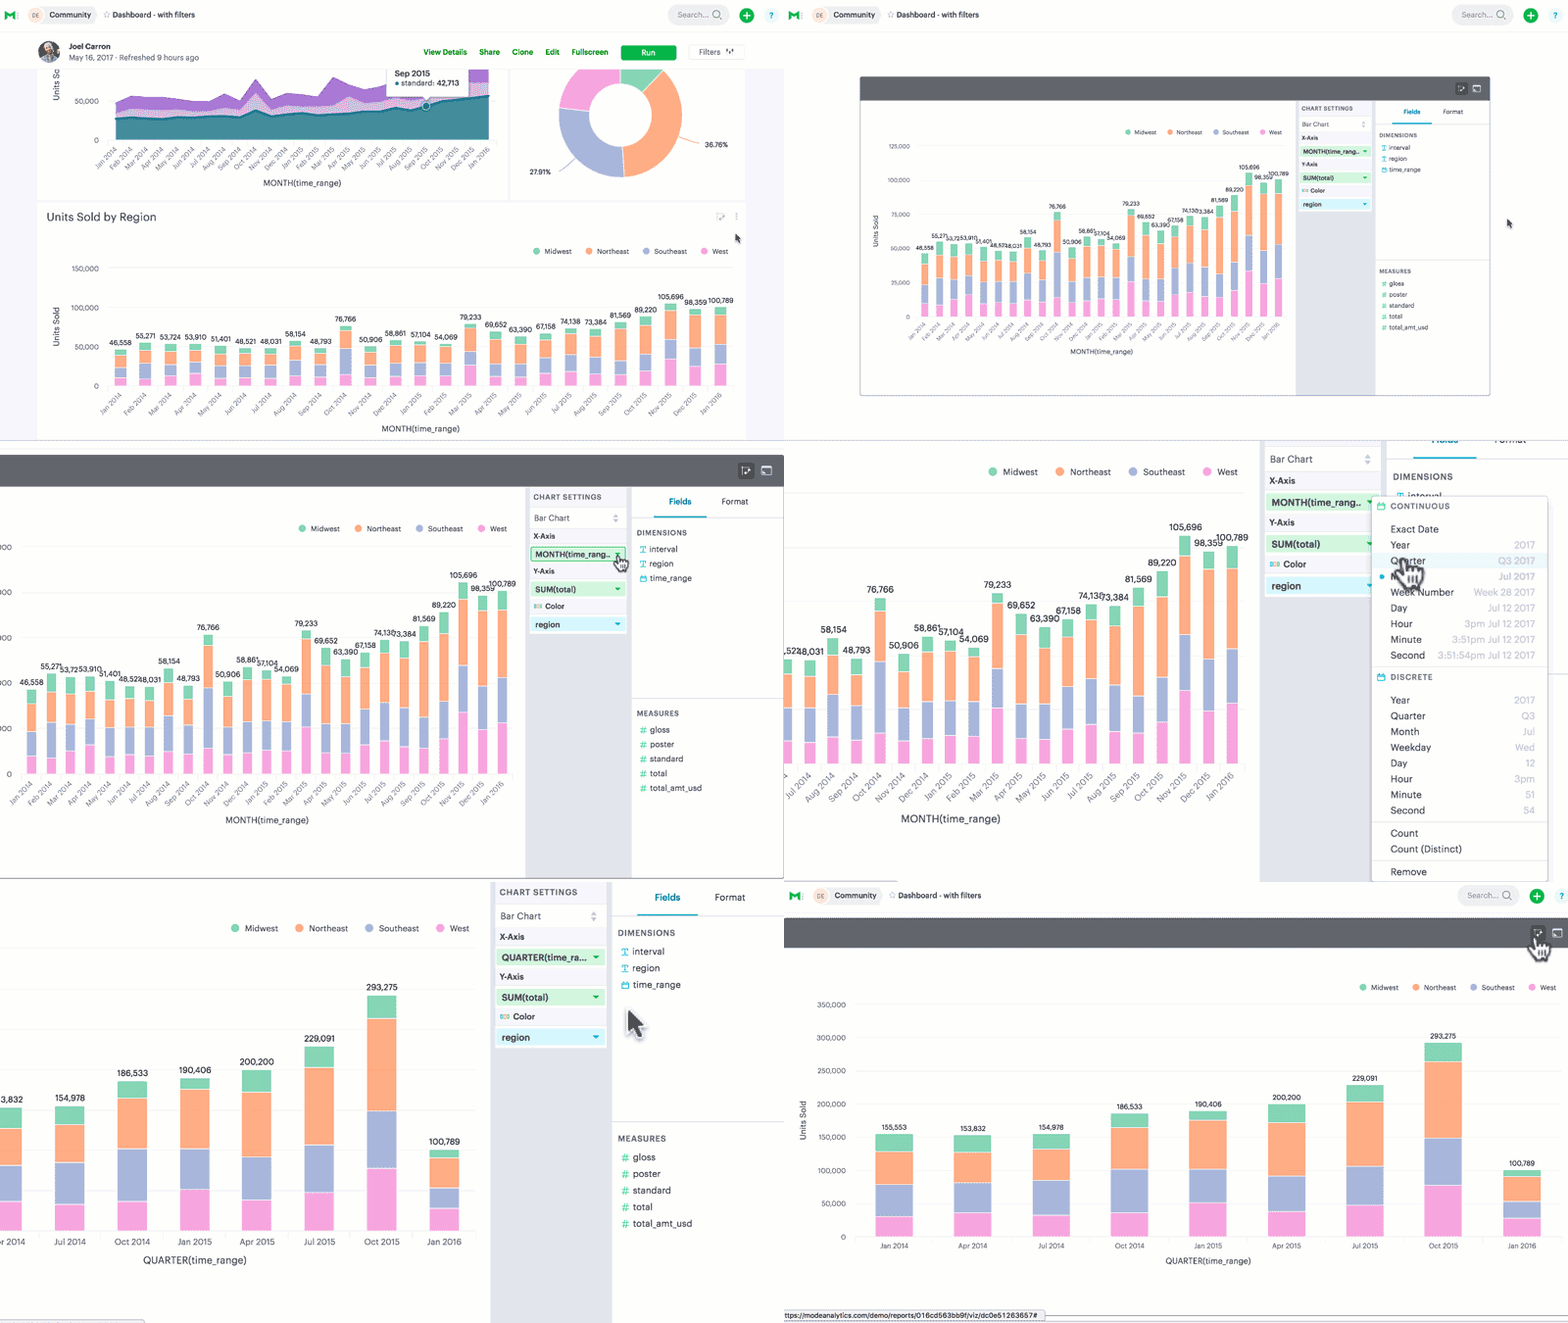
When you share a dashboard or ad hoc analysis with someone in your business, they can click into any chart in your report to access intuitive, drag-and-drop controls for exploring a data set. Here, a viewer can instantaneously switch from a monthly view to a yearly one, without having to modify SQL or wait for a report to re-run.
In addition, all of the underlying data is available to explore right in the expanded view. If, for example, you answered a question about one step of the funnel, and the data includes conversion rates for every other step, someone else on your team can quickly switch to a different conversion metric, answering follow up questions on their own.
Note: Chart exploration from the report view is a feature of the Mode Plus Plan.
Faster Iteration
The new charting tools aren't for report interactivity alone. They're a simpler, more powerful way to explore and build visualizations during initial report creation.
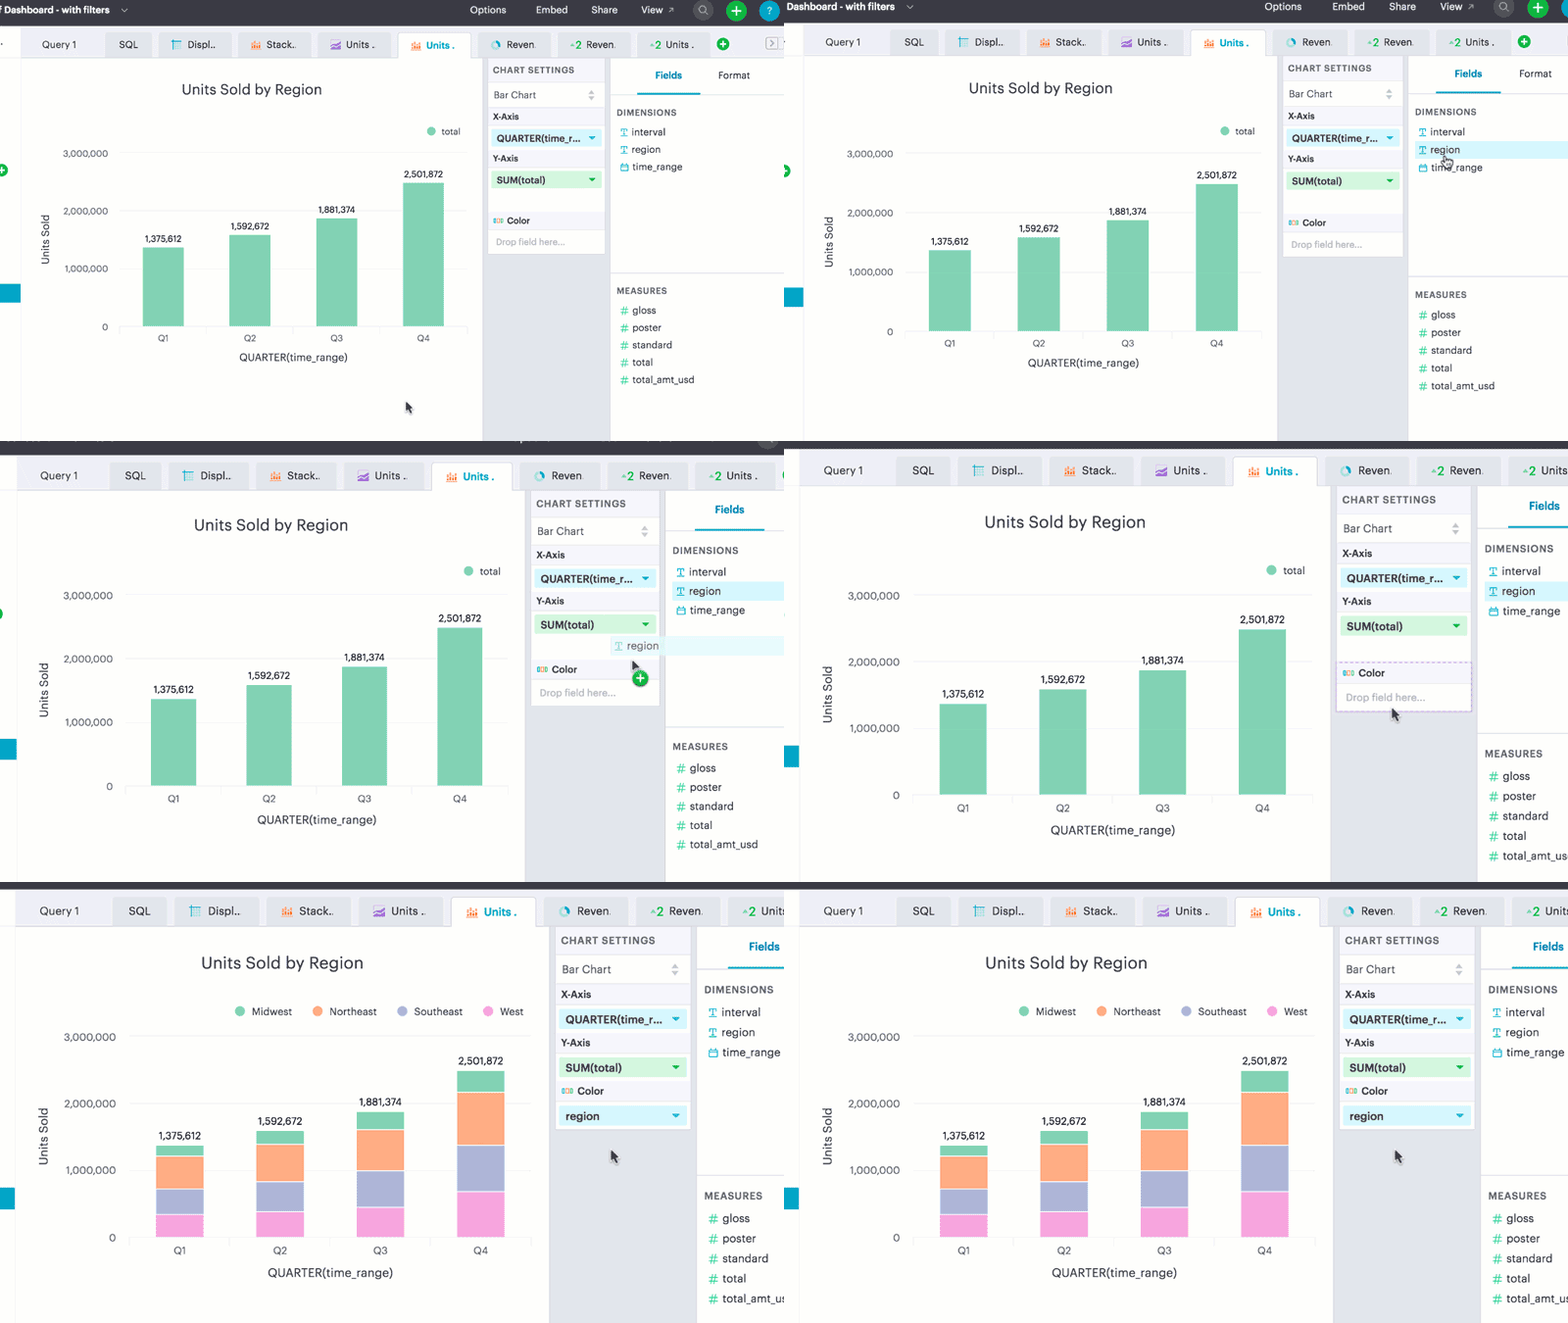
After writing a SQL query in the Editor, click “Add Chart” to jump into the new charting tools. The query's data is automatically organized into dimensions and measures based on data type, helping you quickly grasp which fields are best suited for categorizing or aggregating, respectively. Drag and drop fields into the X-axis, Y-axis, and Color drop zones, then right click on a field to quickly iterate through aggregations.
Tons of New Chart Options
In addition to fostering code-free exploration, the new charts yield better looking results. Presenting impactful analysis relies on flawless data, presented without distraction. Even if your data is perfect, small visual issues can decrease its impact. The new charts introduce dozens of powerful new chart options to make it easier to present meaningful work, including:
- Totals on stacked bar charts
- Bar totals for more than one series
- Independent formatting for secondary y-axis
- Logarithmic y-axis
- Automatic axis labels
- Legend positions
- Custom legend title
- Better hovers
- Day of week date format
- Negative number handling in line and bar charts
- Line+bar charts that look fly
The new Mode charts provide a foundation that is much faster to develop on. Expect new chart types and formatting options as we continue to roll out the rest of the code-free data exploration functionality over the next few months. Up next is more chart filtering options, followed by drilldowns!
Questions? Feedback? We love hearing from you. Send us a note at hi@modeanalytics.com or start a chat in the product. Here's to a refreshing summer dip into uncharted waters!


