Sign in
Try for free
Request demo
Ad Hoc Analysis
Answer challenging and important questions with standalone reports
Advanced Analytics
Analyze and model on the same platform as your charts and dashboards
Self-Serve Reporting
Build your own modern reporting, backed up by governed datasets and metrics
Custom Data Apps
Build custom internal tools for thousands of data and business team needs
Interactive Dashboards
Share the insights you find through drag-and-drop visual analytics tools
Features
Resource Center
The data scientist toolbox
Our Blog
Data insights for everyone
Learn SQL
Answer data questions with SQL
Learn Python
Analyze business data with Python
Categories
Analysis
Mode updates
Visualization
Data teams
All articles
If a tree falls in the forest and no one is there to hear it, does it make a sound?
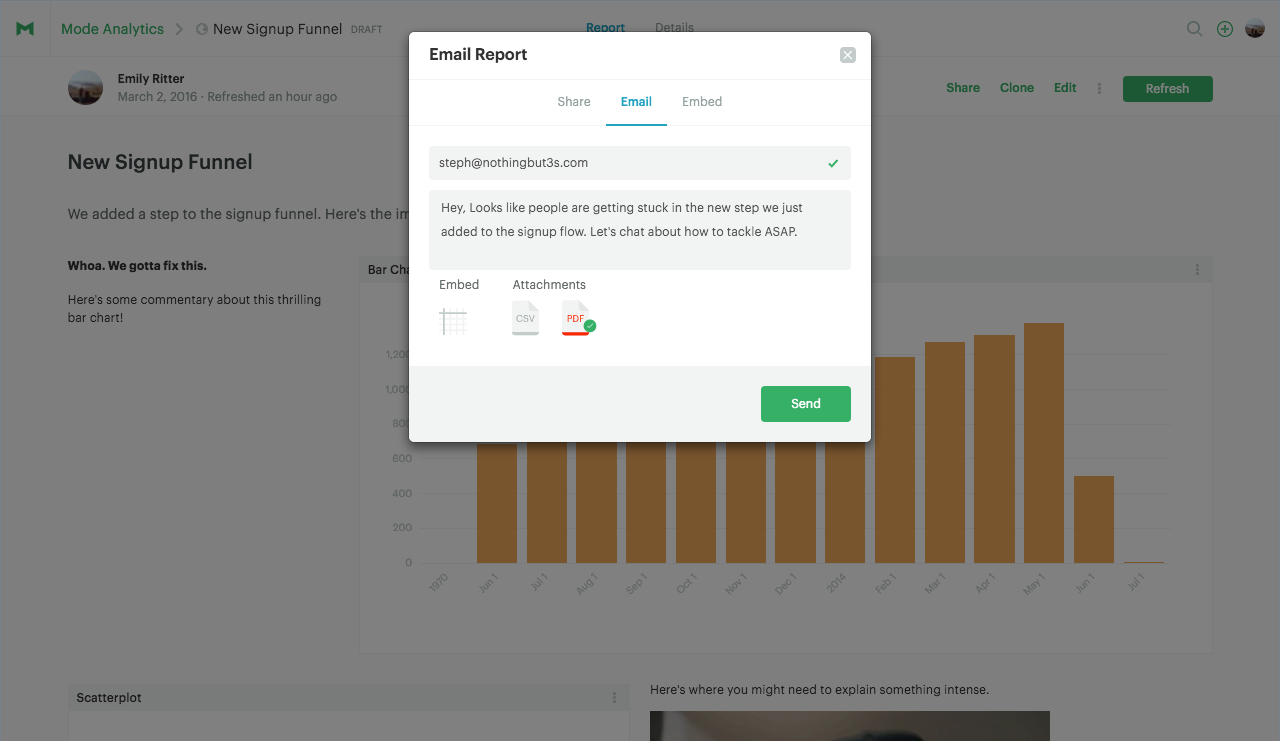
We're not entirely sure. What we do know is that if you analyze some data and no one else sees your work, it probably doesn't make much of an impact. And it should.
October 19, 2024•
October 19, 2024• 2 minute read
October 19, 2024• 4 minute read
March 3, 2016• 2 minute read
Emily Ritter
VP of Marketing
February 23, 2016• 3 minute read
Starbucks green. UPS brown. Target red. Some of the most recognized brands have built their visual identity on just one color. They create this fundamental association by including the color everywhere—from commercials and logos to packaging and websites.
Melissa Bierly
Content Marketing
January 21, 2016• 2 minute read
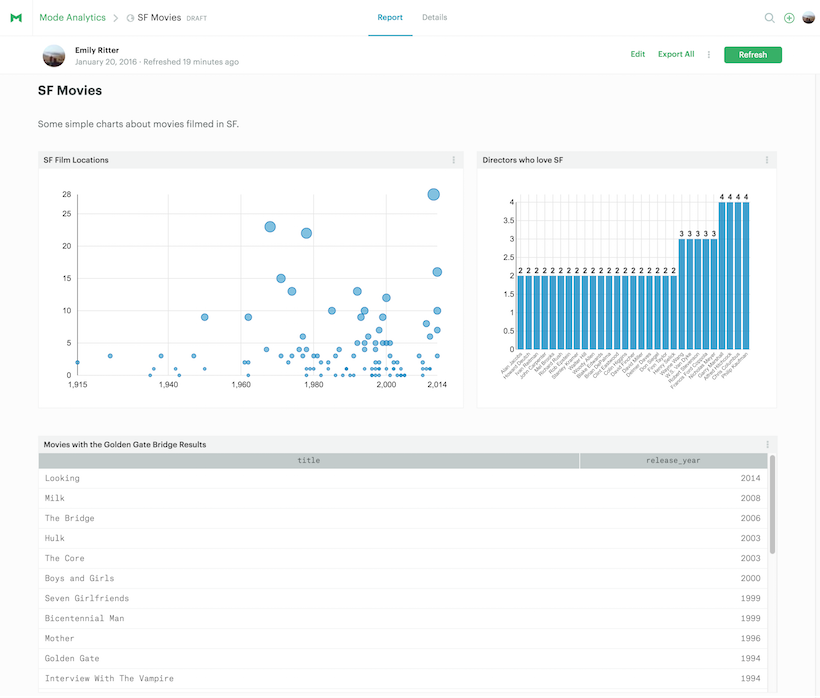
Sometimes you just want to put two charts next to each other.
Now you can.
Today we're rolling out a new drag-and-drop report builder that makes it faster and easier to organize a report's layout.
January 8, 2016• 2 minute read
When it comes to distributing analysis, it can be helpful to put data where folks discover it over the natural course of their day. For some Mode customers, this means embedding reports into an internal wiki or team-specific tools like Salesforce or Zendesk. We just released a few new features to make embedded reports even more useful to people throughout your organization.
December 17, 2015• 3 minute read
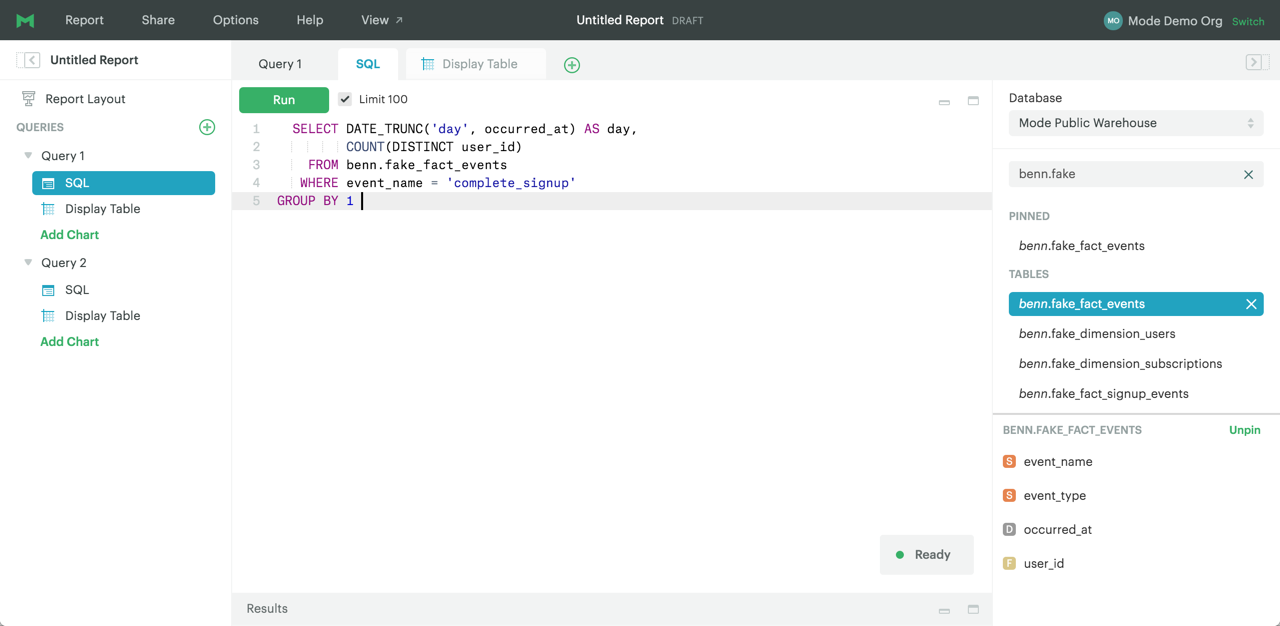
Like the analysts who use Mode day-in and day-out to answer some of the hardest questions a business can throw at them, we hammer on our product for hours, every day. We're explorers, trying to make sense of data and telling stories once we do.
December 9, 2015• 6 minute read
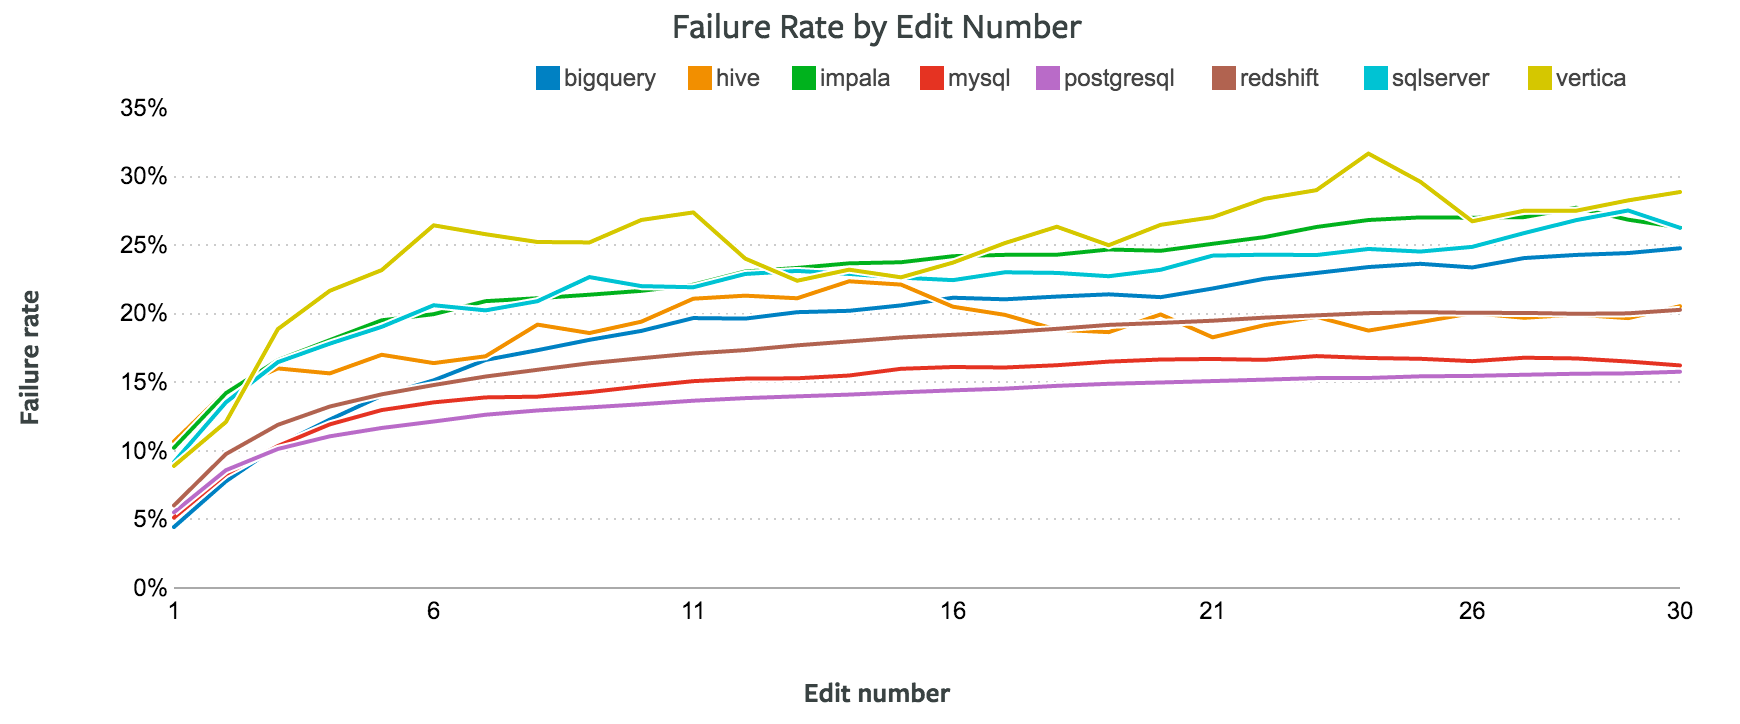
Which database is best? The question, obviously, depends on what you want to use it for.
Benn Stancil
Co-founder & Chief Analytics Officer
Get more from your data
Your team can be up and running in 30 minutes or less.