No matter how you're looking to present your data, there's a seemingly endless number of Python libraries and resources to use (check out ten of our favorites).
You may know Plotly as an easy-to-use online data visualization tool, but did you know they also offer a Python API so data scientists can use Plotly and Python together offline? We're excited to add Plotly to the growing list of supported libraries in Mode Python Notebooks.
With Plotly and Mode you can build beautiful, interactive data visualizations on top of a Python dataset and share it with teammates instantly.
How does it work?
To use Plotly offline, import Plotly into your Python notebook like you would import any other library. We use Plotly's offline library to give you all of the Plotly functionality, while keeping all of your results in Mode.
	from plotly.offline import download_plotlyjs, init_notebook_mode, iplot
	from plotly.graph_objs import *
	init_notebook_mode()
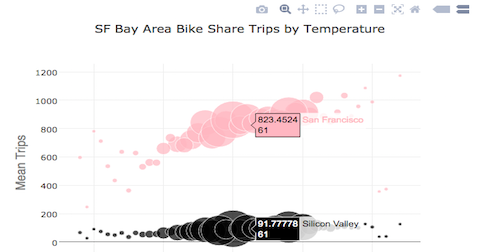
Check out this example using data from Bay Area Bike Share, a program San Francisco Bay Area residents and tourists use to rent bikes. Using SQL, we first combined bike usage data with weather data. The query results are then instantly available in the connected Python Notebook for further analysis. There, we grouped the data and used Plotly to build the bubble chart you see below. In one click, we added the interactive visual to the report, which lives online at a shareable URL (and enables us to embed it here).
Instantly, interactive graphics layered on top of a Python-created dataset can be shared with your entire organization. Your report viewer can engage with clean, professional-quality visualizations without any need to set up a Python environment, wade through an entire notebook to get to the good stuff, or ask for an update.
Have questions?
We love hearing from you! If you have questions about using Plotly—or any other Python data visualization techniques—reach out to the team using the chat icon in the product. Or if you would rather explore the new Python data visualization capabilities on your own, sign up to get started with your free, 14-day trial.


