Mode updates
Webhooks and the Mode API are here
Analysts turn to Mode as the toolkit of choice for their work: SQL and Python-powered data exploration, visualization, and advanced analytics, delivered to teammates via accessible and interactive dashboards.
Editor’s picks in Mode updates

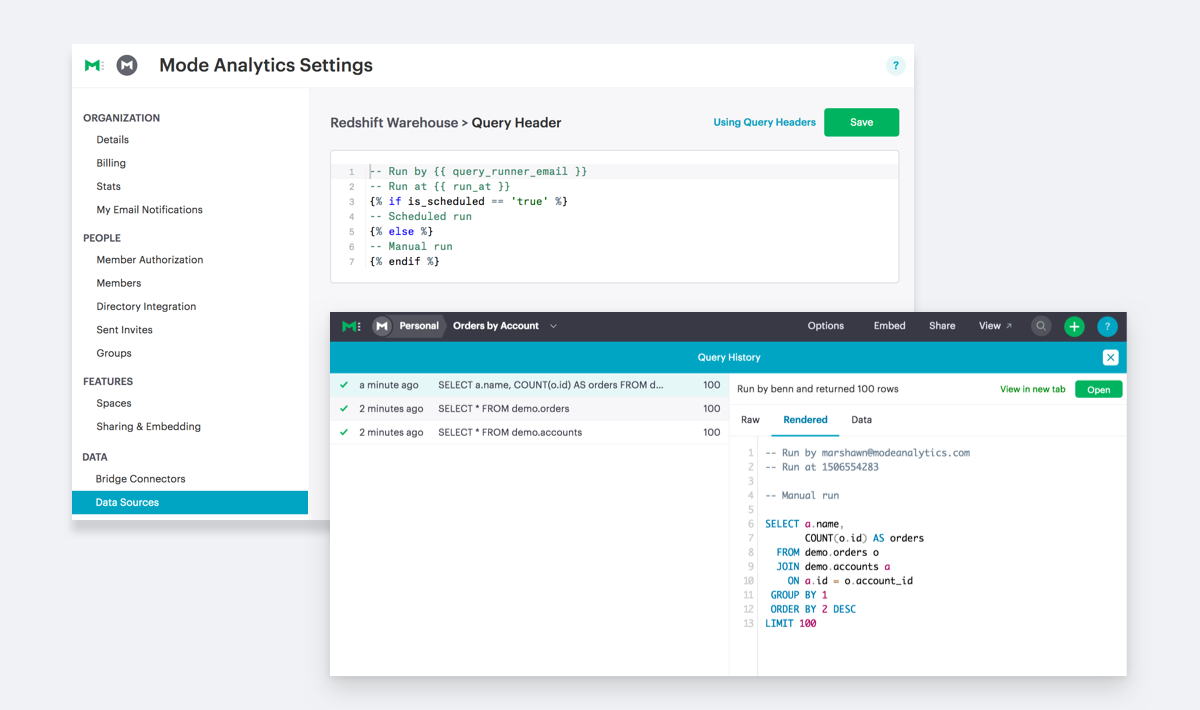
Better Admin Controls with Query Headers
September 28, 2017• 2 minute read
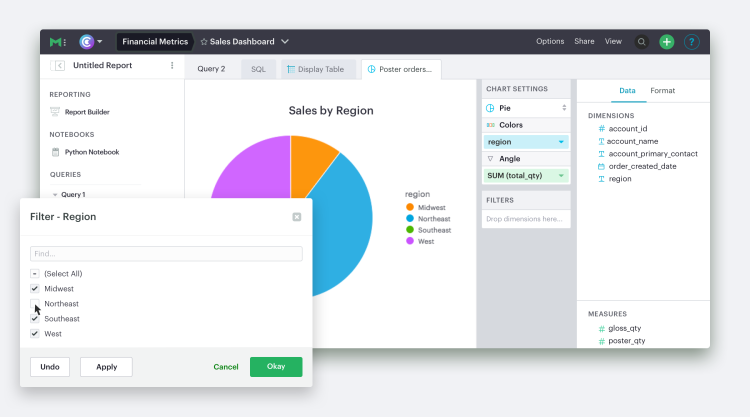
Earlier this week, we released visualization filters that allow everyone on Mode to interact more deeply with dashboards to find new answers.

Angeline Char
Product Marketing

Product Update: Visualization Filters
September 26, 2017• 2 minute read
Over the last few months, we've been heads down building new power into Mode to help everyone explore data.
Earlier this summer we released report filters and the new charts. Analysts are using these new features to turn what were previously static reports into powerful tools for anyone to answer routine questions.

Angeline Char
Product Marketing

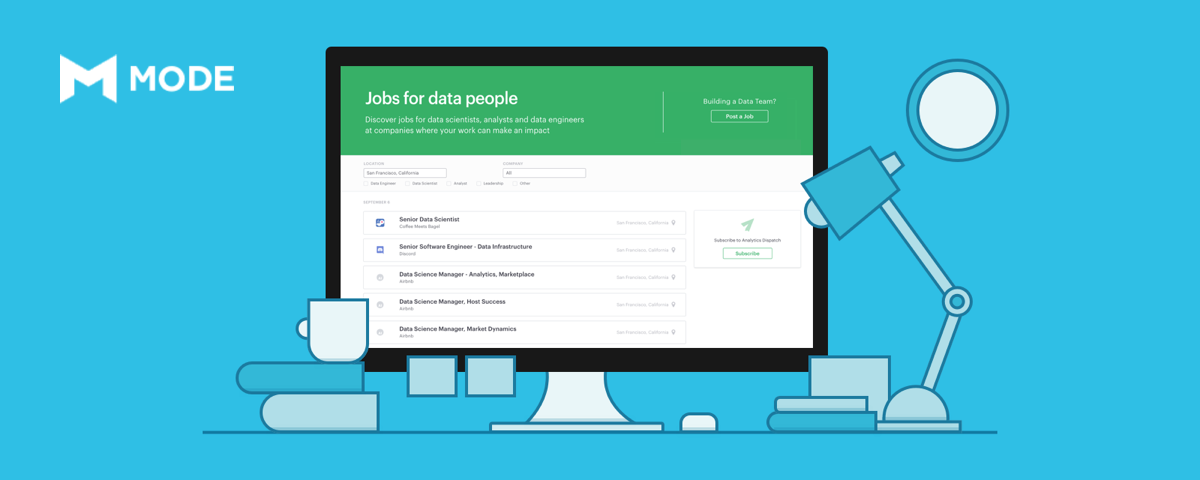
How to Find the Best Data Jobs
September 14, 2017• 4 minute read
Pairing great data talent with great data jobs
As an analyst, finding a great job can be tough. We're all too familiar with this here at Mode. The analysts among us have been there ourselves, and we constantly hear from community members about the headache of finding relevant data jobs. Thanks to the murky use of keywords like "analyst" in job posts, job hunting means wading through a swamp of irrelevant posts. So, we decided to make our own job board; a curated list of the best data jobs.

Liam Hausmann
Content Marketing
WrangleConf 2017: Facing bias, ethical obligation, and your audience
July 26, 2017• 6 minute read
As it has in previous years, WrangleConf 2017 brought to the foreground some of the most pressing issues for data scientists today. While there were certainly tactical discussions about how analysts ply their trade, the most powerful threads focused on the dangers of bias in all its forms and the need to meet audiences where they are when presenting data.
Cindy Willis-Chun
Content

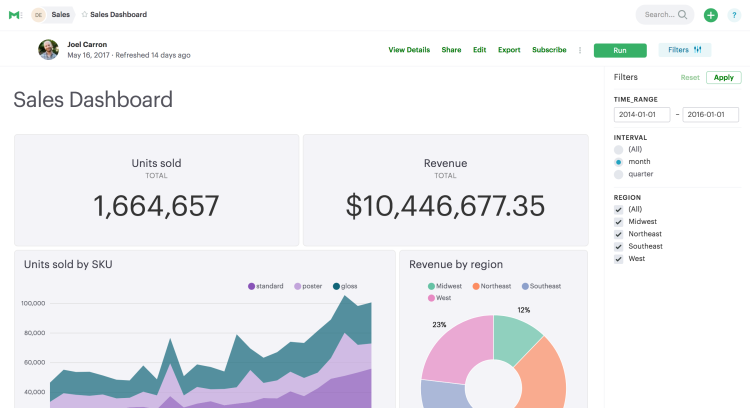
Filters: Fast, Easy Data Exploration
May 31, 2017•
A couple of weeks ago we announced a series of new code-free data exploration features to let everyone find answers hidden in data. The functionality is rolling out in four phases over the next couple of months. Phase one, Filters, is now live.

Emily Ritter
VP of Marketing
